

Date: Sat, Oct 04, 2025 | 05:50 PM GMT
The cryptocurrency market is showing strength as the prices of both Bitcoin (BTC) and Ethereum (ETH) have surged over 11% in the past 7 days. Riding this resilience, major altcoins have posted significant gains — excluding STBL (STBL).
STBL has dropped 8% today, extending its weekly decline to a steep 41%. Yet beyond the red candles, what makes it interesting is its technical structure, which may be setting up for a bullish reversal in the near term.
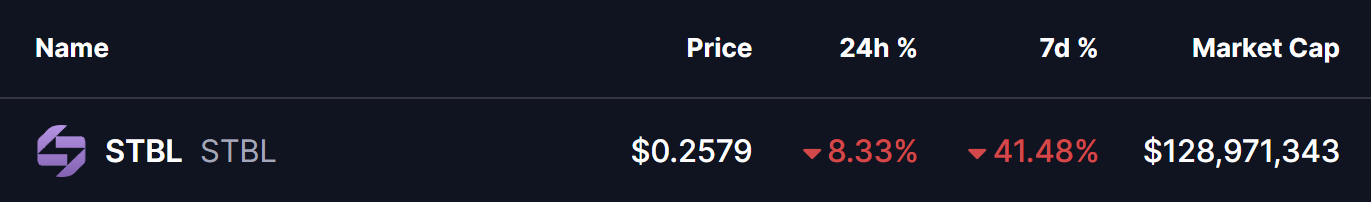 Source: Coinmarketcap
STBL Mirrors ASTER’s Breakout Pattern
A look at the 4-hour chart reveals a striking similarity between STBL and Aster (ASTER) — both of which have followed comparable price structures.
Recently, ASTER broke out of a falling wedge pattern, a bullish reversal setup often seen near market bottoms. After confirming its breakout and reclaiming the 30-period moving average, ASTER surged more than 50% from its wedge support zone, showing strong momentum backed by a clear shift in trend.
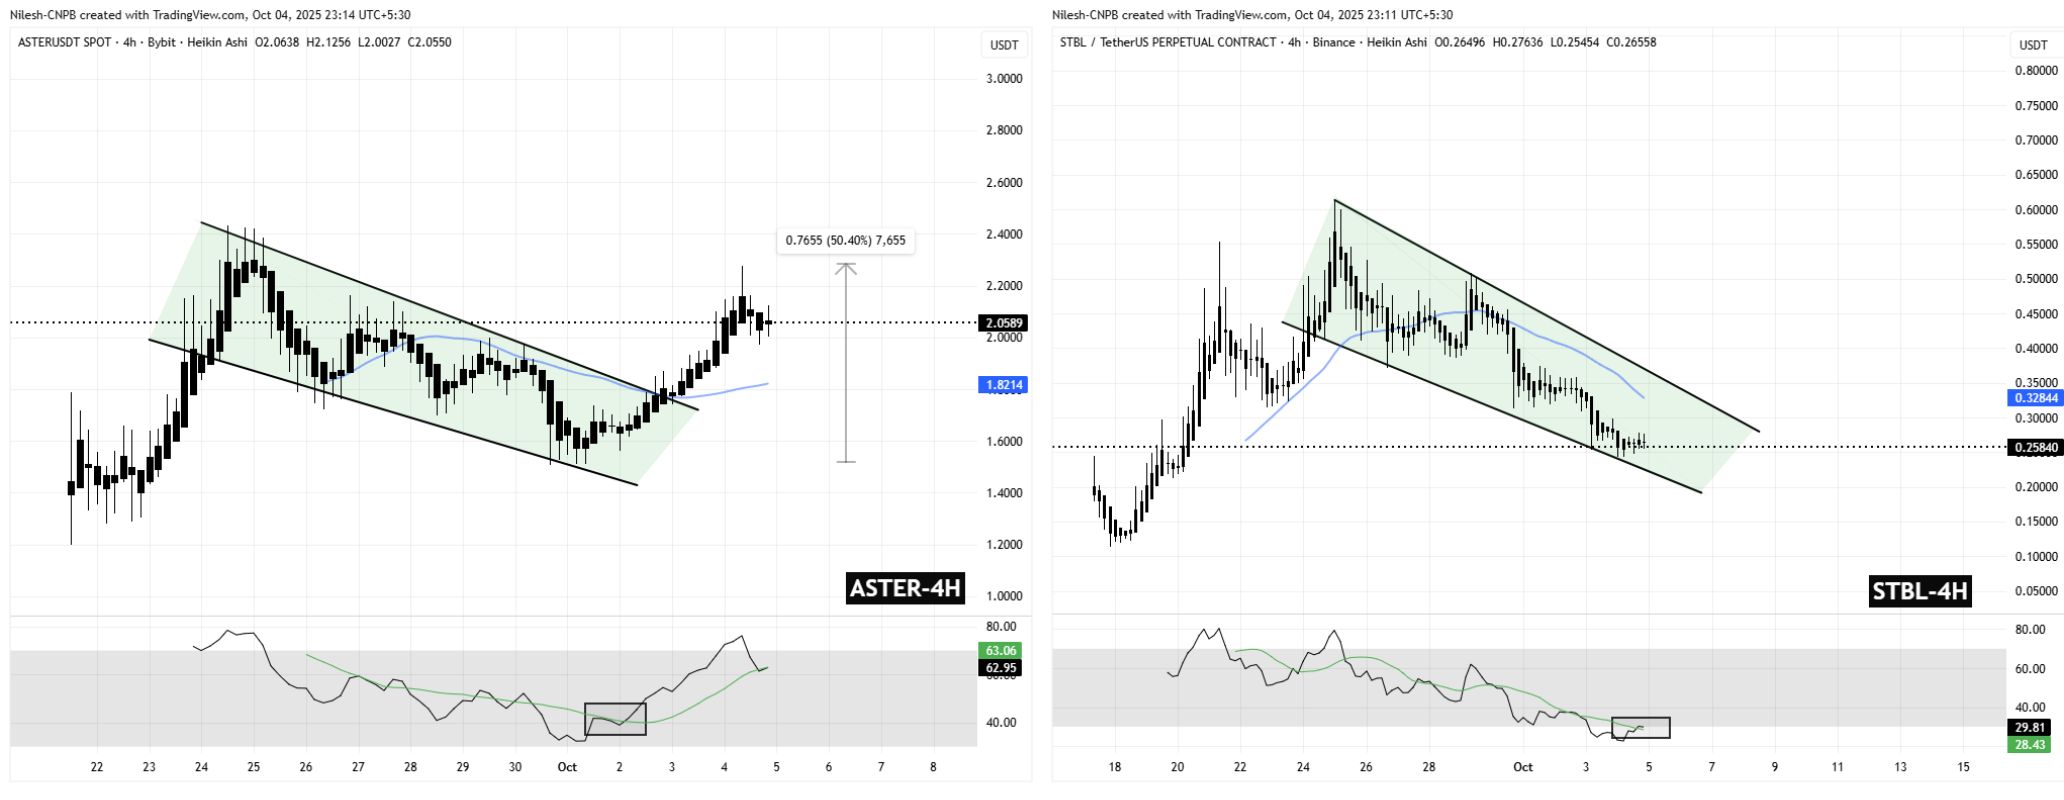 ASTER and STBL Fractal Chart/Coinsprobe (Source: Tradingview)
STBL now seems to be tracing the same fractal path. It remains inside a well-defined falling wedge, testing the lower boundary, while the Relative Strength Index (RSI) shows a bullish divergence — meaning that while price has made lower lows, RSI has made higher lows, signaling weakening bearish pressure.
What’s Next for STBL?
If STBL follows the same structure that ASTER displayed, the token could be setting up for a sharp upside move once it breaks above the 30 MA around the $0.3284 resistance area. A confirmed breakout from the wedge’s upper resistance trendline could potentially trigger a bullish reversal, aligning with the fractal similarity.
Of course, fractals are not foolproof — they are historical echoes of market behavior, not guarantees. Still, the resemblance between STBL’s current setup and ASTER’s recent breakout is difficult to ignore.
For now, the focus remains on the wedge support trendline, which will be key to keeping this bullish outlook intact.

