
Bitcoin (BTC/USDT) 4H Technical Analysis: Descending Trend, Fair Value Gap and Key Resistance Levels
Looking at Bitcoin's 4-hour chart, the market continues to show a bearish structure. Selling pressure that developed around the 84,893 USDT region has been followed by a series of lower highs. The rejection near 82,022 USDT is particularly important, as it reinforces the current descending structure.
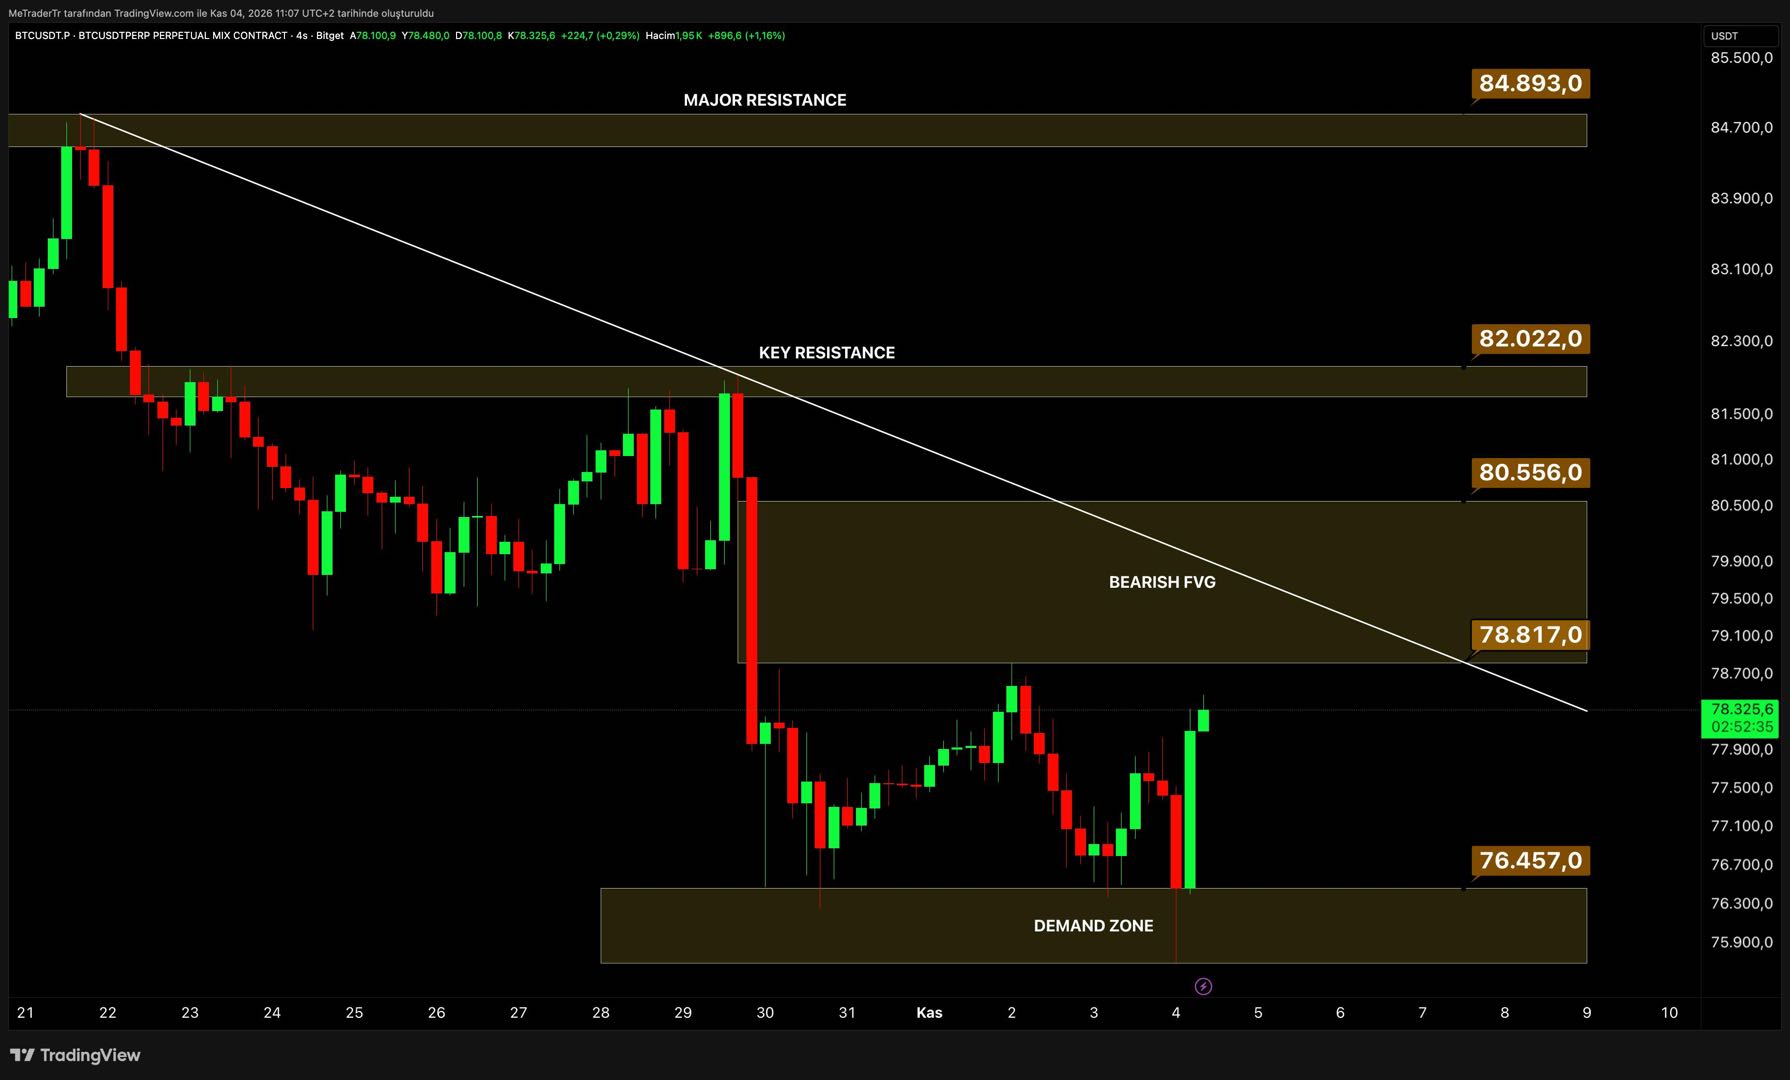
Following the recent decline, Bitcoin found buying interest around the 76,457 USDT demand zone and has since attempted to recover. However, I do not consider this reaction a confirmed trend reversal. There are still several important resistance levels that buyers need to overcome.
Descending Trend and Fair Value Gap
The first area I am monitoring is the bearish Fair Value Gap (FVG) between 78,817 and 80,556 USDT.
This zone represents a price imbalance created during the previous aggressive sell-off. If Bitcoin continues to recover, price may revisit this area. However, the FVG also represents a potential resistance zone where selling pressure could reappear.
A move above 78,817 USDT would bring price into the FVG. Nevertheless, I would not interpret this move alone as confirmation of bullish momentum.
For me, the more important development would be a decisive 4-hour candle close above 80,556 USDT, followed by sustained price action above that level.
Such a move could indicate that selling pressure within the FVG is beginning to weaken.
Bullish Scenario:
If Bitcoin manages to reclaim 80,556 USDT and maintain its position above this level, the next important resistance would be 82,022 USDT.
This area previously acted as a rejection point and represents an important lower high within the current descending market structure.
A confirmed breakout above 82,022 USDT could provide stronger technical evidence that the bearish structure is beginning to weaken.
In that scenario, the next major resistance area would be located around 84,893 USDT.
However, I would not interpret a single resistance breakout as confirmation of a new bullish trend. A more reliable structural shift would require price to establish higher highs and higher lows while maintaining acceptance above previously broken resistance levels.
Bearish Scenario:
Bitcoin may encounter renewed selling pressure within the 78,817–80,556 USDT bearish FVG or around the descending trendline.
If price reaches these areas, shows a clear rejection and begins moving lower again, the existing bearish structure could remain intact.
Under this scenario, I would turn my attention back to the demand zone around 76,457 USDT.
This area has already attracted buyers and produced a notable upward reaction during the recent price action.
However, demand zones should not be assumed to provide support on every test. If Bitcoin returns to this area, the strength of the buying reaction and the 4-hour candle closes will be important factors to monitor.
Market Outlook
From my perspective, Bitcoin's 4-hour market structure remains bearish. Although the recent reaction from the 76,457 USDT demand zone is significant, there is not yet sufficient technical confirmation to suggest a sustained bullish reversal.
For now, my primary focus remains on the bearish FVG between 78,817 and 80,556 USDT.
Sustained price action above 80,556 USDT could bring the 82,022 USDT resistance into focus. A confirmed breakout above that level could then support a broader recovery towards 84,893 USDT.
On the other hand, renewed selling pressure from the FVG or the descending trendline could shift attention back towards the 76,457 USDT demand zone.
My approach is not to predict exactly where the market will move, but to identify important price levels, observe how the market reacts and adjust my assessment as the structure develops.
MeTrader
Güncel Battal
Disclaimer: This article is contributed by a Bitget trader. The views expressed are the author’s own, do not necessarily reflect those of Bitget, and should not be considered financial or investment advice. cryptocurrency trading involves significant risk, and technical scenarios may change depending on market conditions. Qualified professionals should be consulted prior to making financial decisions.


- Descending Trend and Fair Value Gap
- Market Outlook