
Nasdaq Plunges 5.52% Into Correction as AI Regulatory Fears Spark Chip Sell-Off: Three Risks for NAS100 Traders to Watch
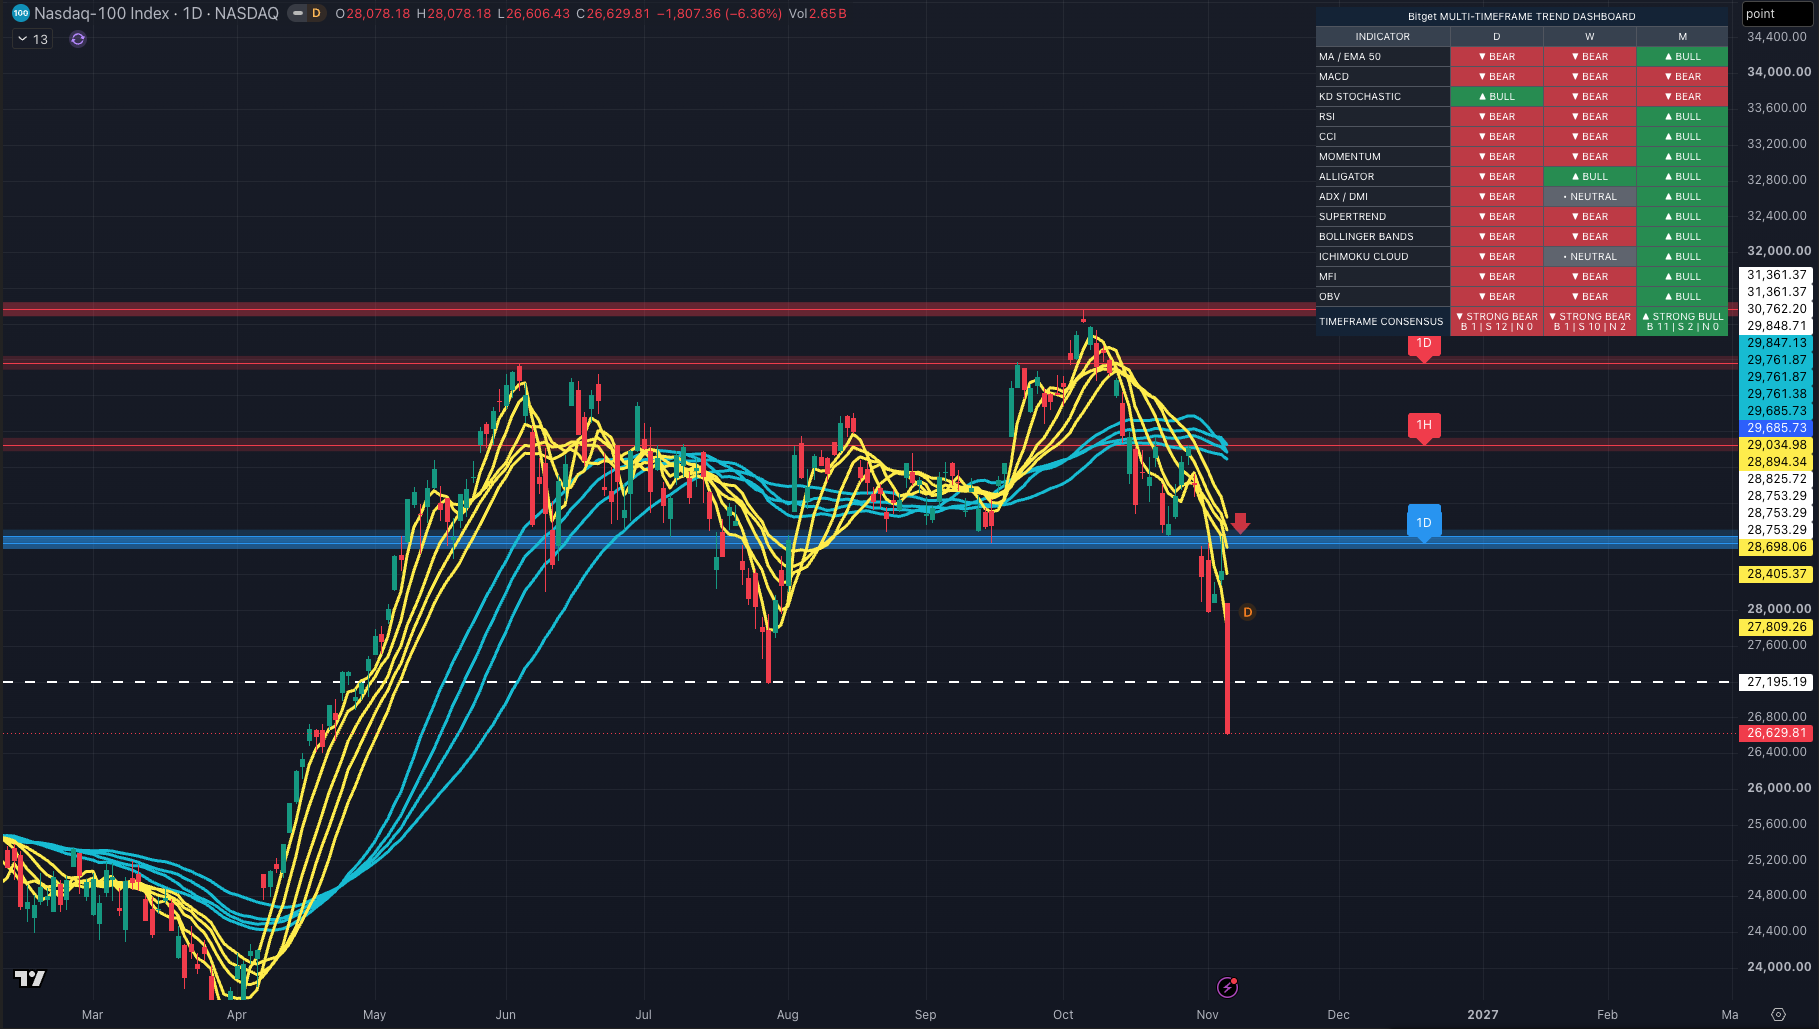
The post-midterm election rebound in U.S. stocks quickly reversed, with AI-related shares becoming the focus of a broad market sell-off. U.S. equities tumbled on November 5, with the Nasdaq falling 5.52% to close at 24,315.00—its biggest one-day decline in 19 months. The index ended more than 10% below its October 6 closing high, entering technical correction territory.
The S&P 500 fell 4.36% to 7,353.73, while the Dow Jones Industrial Average dropped 3.44% to 51,523.06. The sell-off reflected more than profit-taking in technology stocks. Investors were reassessing whether the rapid growth expectations underpinning the AI rally could still justify current valuations as regulatory and interest-rate risks increased.
Fears of Slower AI Infrastructure Expansion Hit Chip Stocks First
At the heart of the sell-off were concerns about the pace of AI infrastructure expansion.
Democrats regained control of Congress in the midterm elections and secured victories in some states where opposition to new data centers has been growing. The results raised investor concerns that data center approvals and construction could face greater obstacles.
Melissa Brown, global head of investment decision research at SimCorp, noted that even if newly elected members of Congress and governors cannot halt AI construction altogether, a slowdown alone could undermine growth expectations built on rapid expansion.
For markets, the key issue is not necessarily whether AI demand will disappear, but when that demand will translate into revenue. Delays in data center construction could force investors to reassess timelines for chip shipments, computing capacity deployment, and related investment returns.
Chip stocks consequently led the decline. Nvidia (NVDA) fell more than 9%, while the Philadelphia Semiconductor Index plunged over 12%. Qualcomm (QCOM) dropped 9.5%, pressured not only by the sector-wide sell-off but also by fourth-quarter smartphone chip sales that missed market expectations, further weakening buying interest.
Selling Spreads to Data Centers and Energy as the AI Investment Chain Comes Under Pressure
The correction did not stop at semiconductors. Selling spread across the broader AI supply chain.
Data center operators IREN and Applied Digital (APLD) each fell more than 14%, while CoreWeave (CRWV) declined nearly 10%. GE Vernova (GEV) and Constellation Energy (CEG), both beneficiaries of AI-driven electricity demand, dropped 7.5% and 2.5%, respectively.
The moves suggest that markets are repricing more than chip demand. Growth expectations for data center operations, power equipment, and energy supply are also being reassessed. When the pace of investment across an entire industry chain comes into question, stocks previously lifted by the same theme can face simultaneous valuation compression.
Large-cap technology stocks also weakened. Meta (META) fell 4%, while Amazon (AMZN) and Alphabet (GOOGL) each declined 2.2%, adding pressure to the major indexes.
Trading Volume Surges, but a Technical Correction Does Not Confirm a Bottom
S&P 500 constituents lost approximately $3 trillion in combined market value in a single day. Trading volume on U.S. exchanges reached 26.9 billion shares, roughly 52% above the 17.7 billion-share average over the previous 20 trading sessions, showing that the decline was accompanied by a substantial increase in activity.
However, a sharp, high-volume decline does not, on its own, confirm that the market has bottomed—and it does not mean that further steep losses are inevitable. Investors still need to watch whether any rebound can hold, whether heavily weighted technology stocks stabilize, and whether the policy concerns change materially.
It is also important to distinguish a technical correction—a decline of more than 10% from a peak—from a bear market, commonly defined as a decline of at least 20%. Despite the sharp one-day losses, the S&P 500 and Nasdaq remained up 7.4% and 4.6%, respectively, for the year.
NAS100 Outlook: Policy, Interest Rates, and Technology Stocks
For traders following the Nasdaq-100 Index CFD (NAS100), three key variables deserve attention.
1. Will AI Regulatory Concerns Turn Into Actual Restrictions?
Markets are currently pricing in policy expectations. Traders should monitor data center approvals, local construction restrictions, and capital expenditure guidance from technology companies.
If companies maintain their expansion plans, some concerns could ease. If construction is delayed or spending plans are reduced, valuation pressure could intensify.
2. How Will Nonfarm Payrolls Affect Interest-Rate Expectations?
Cleveland Federal Reserve President Beth Hammack and Richmond Federal Reserve President Thomas Barkin both raised the possibility of future rate hikes in their remarks. Markets will next focus on the U.S. October nonfarm payrolls report, scheduled for release on November 6.
Strong employment and wage data could reinforce expectations that interest rates will remain elevated, putting pressure on growth-stock valuations. Significantly weaker data could fuel expectations of monetary easing, but might also raise concerns about an economic slowdown.
Traders need to assess both the data and the market’s reaction rather than treating strong or weak figures as automatic buy or sell signals.
3. Can Heavily Weighted Technology Stocks Stabilize?
The performance of semiconductor leaders such as Nvidia, along with other large-cap technology stocks, provides important clues for NAS100.
However, the Nasdaq Composite cited in this article is not the same as the Nasdaq-100 Index underlying NAS100. The 24,315.00 level should therefore not be used directly as a NAS100 trading level or support reference.
For trading analysis, use the NAS100 quotes, contract specifications, and charts provided by your trading platform.
Trading NAS100 Volatility: Put Risk Management Before Market Entry
AI regulatory concerns, steep losses in chip stocks, and interest-rate uncertainty have made technology stocks more sensitive to incoming developments. For CFD traders, identifying market direction is only part of the task. Managing leverage, position sizes, and event risk is equally important.
Prices can move rapidly around major economic releases, and stop-loss orders may execute at less favorable prices because of market gaps or changes in liquidity.
Want to track the index performance of leading U.S. technology companies? Visit Bitget CFD to view live quotes and trading specifications for the Nasdaq-100 Index CFD (NAS100). Confirm that the product is available in your jurisdiction and assess the risks before taking long or short positions in line with your trading plan.
All trading education provided by Bitget is for educational purposes only and should not be considered financial advice. The strategies and examples shared are for reference only and may not reflect actual market conditions. CFD trading involves significant risk, including the potential loss of capital. Past performance does not guarantee future results. Please conduct thorough research and ensure that you understand the risks involved. Bitget is not responsible for any trading decisions made by users.


- Fears of Slower AI Infrastructure Expansion Hit Chip Stocks First
- Selling Spreads to Data Centers and Energy as the AI Investment Chain Comes Under Pressure
- Trading Volume Surges, but a Technical Correction Does Not Confirm a Bottom
- NAS100 Outlook: Policy, Interest Rates, and Technology Stocks
- Trading NAS100 Volatility: Put Risk Management Before Market Entry