Bitcoin Halving History: Timeline, Dates & Price Chart
Introduction
Bitcoin halving is one of the most important and anticipated events in the world of cryptocurrencies. This phenomenon, coded into Bitcoin’s protocol, cuts the reward that miners receive by half every four years, directly affecting the rate at which new Bitcoins enter circulation. For investors, understanding the history and data behind Bitcoin halvings — including the dates, block numbers, timeline, and corresponding price charts — provides vital insight into crypto market dynamics and Bitcoin’s deflationary design. This article offers a detailed analysis of all Bitcoin halving events (2012, 2016, 2020, and 2024), their market outcomes, and what the community expects for the next halving in 2028.
What Is Bitcoin Halving?
Bitcoin halving is a pre-programmed event that occurs every 210,000 blocks (approximately every four years), as outlined by Satoshi Nakamoto, Bitcoin’s pseudonymous creator. During each halving, the reward granted to miners for validating transactions and securing the network is reduced by half. This event is central to Bitcoin’s monetary policy, steadily reducing the new BTC supply over time and making Bitcoin increasingly scarce.
Why Does Bitcoin Halving Matter?
Bitcoin’s supply is capped at 21 million coins. Halving events serve to reduce the inflation rate and ensure a gradual, predictable rate of new supply. Historically, each halving has coincided with increased investor attention, volatility, and ultimately, bullish price cycles as BTC becomes more scarce and perceived value rises.
The Timeline of Bitcoin Halvings: From 2009 to 2028
Let’s explore the detailed timeline, block rewards, event dates, and key statistics for each Bitcoin halving.
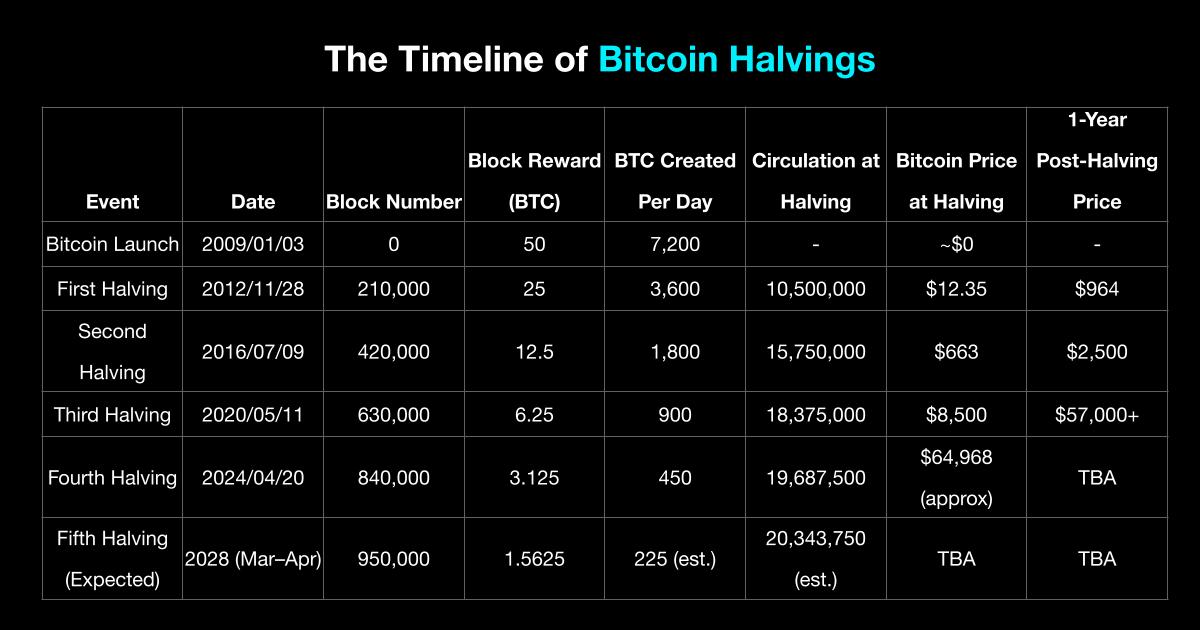
Bitcoin Halving History: An In-Depth Review
Bitcoin Genesis and Monetary Policy
When Bitcoin launched in January 2009, its value was virtually zero, and miners earned 50 BTC per block. This high block reward incentivized early network participation and security. Satoshi’s vision embedded a decreasing supply schedule — via halving — to mimic the scarcity of commodities like gold while maintaining predictable inflation.
The First Bitcoin Halving: November 28, 2012
Overview Impact
The first halving occurred at block 210,000, reducing block rewards from 50 BTC to 25 BTC. At this time, 10.5 million BTC (half the total supply) had already been mined. Notably, the halving did not immediately affect the price; Bitcoin was trading at around $12.35. However, by the end of 2013 — less than a year post-halving — Bitcoin soared past $1,100, concluding one of the first major bull runs. This event drew mainstream financial and media attention, laying the groundwork for broad adoption.
Key Statistics:
-
Date: November 28, 2012
-
Price at Halving: $12.35
-
Block number: 210,000
-
Daily Supply Post-Halving: 3,600 BTC
-
One-Year Later: ~$964
-
Miners: SlushPool (notable contributor, associated with early professional mining setups)
The Second Bitcoin Halving: July 9, 2016
Overview Impact
By the second halving, Bitcoin had matured, with growing developer, investor, and public interest. The reward dropped from 25 BTC to 12.5 BTC per block at block 420,000. Bitcoin was trading at $663. Halving once again triggered broader speculation and consolidation. Over the following year, Bitcoin’s price surged, leading to the 2017 bull market and ultimately peaking near $20,000 – attracting institutional players and widespread retail participation.
Key Statistics:
-
Date: July 9, 2016
-
Block: 420,000
-
Price at Halving: $663
-
Reward: 12.5 BTC
-
1 Year Later: ~$2,500
-
Annual Inflation Rate: 8.3% (down from 12.5%)
The Third Bitcoin Halving: May 11, 2020
Overview Impact
The third halving took place at block 630,000, reducing rewards from 12.5 BTC to 6.25 BTC. Pre-halving, Bitcoin traded at roughly $8,500. Despite concerns about mining profitability and global macroeconomic instability (COVID-19 pandemic), the halving marked the beginning of Bitcoin’s largest and fastest bull market to date. By November 2021, Bitcoin’s price peaked just under $69,000. The role of institutional adoption (MicroStrategy, Tesla, PayPal), mainstream media coverage, and growing Bitcoin ETF campaigns fueled unprecedented demand and held the spotlight on Bitcoin’s limited supply.
Key Statistics:
-
Date: May 11, 2020
-
Block: 630,000
-
Price at Halving: ~$8,500
-
Reward: 6.25 BTC
-
Peak post-halving: ~$69,000 (Nov 2021)
-
Annual inflation rate: 1.79%
The Fourth Bitcoin Halving: April 20, 2024
Overview Recent Stats
The most recent halving, at block 840,000, slashed block rewards to 3.125 BTC. Bitcoin was around $64,968 on the halving date. By now, over 93% of all Bitcoin had been mined, and annual inflation dropped under 1%. The market landscape had evolved, with ETFs such as BlackRock’s iShares Bitcoin Trust launching in early 2024, fostering greater institutional adoption.
Key Factors:
-
Date: April 20, 2024
-
Block: 840,000
-
Reward: 3.125 BTC
-
Price at Halving: ~$64,968
-
Daily New BTC: 450
-
Inflation rate: 0.83%
-
Market sentiment: Strong, supported by ETF inflows and macro-hedging narratives
-
Noteworthy: By this halving, over 19,687,500 BTC are in circulation, with only ~1.3 million left to mine.
The Upcoming Fifth Halving: Expected March/April 2028
What to Expect
The fifth halving is projected around block 950,000 — estimated for March or April 2028 — with daily rewards falling to just 1.5625 BTC. By then, less than 5% of all Bitcoin will remain to be mined. As every halving to date has ushered in price appreciation after an initial period of volatility and consolidation, analysts predict similar dynamics. However, macroeconomic conditions, regulatory landscape, and technological advances could introduce new catalysts and variables.
Bitcoin Halving Price Chart, Timeline, and Market Trends
Analyzing price charts and graphs across halving events clearly shows patterns of increasing long-term price floors and intense bull runs in the 12–18 months after each halving. While halving alone doesn’t guarantee bullish movement, scarcity dynamics in tandem with rising demand historically created energetic cycles in Bitcoin’s timeline.
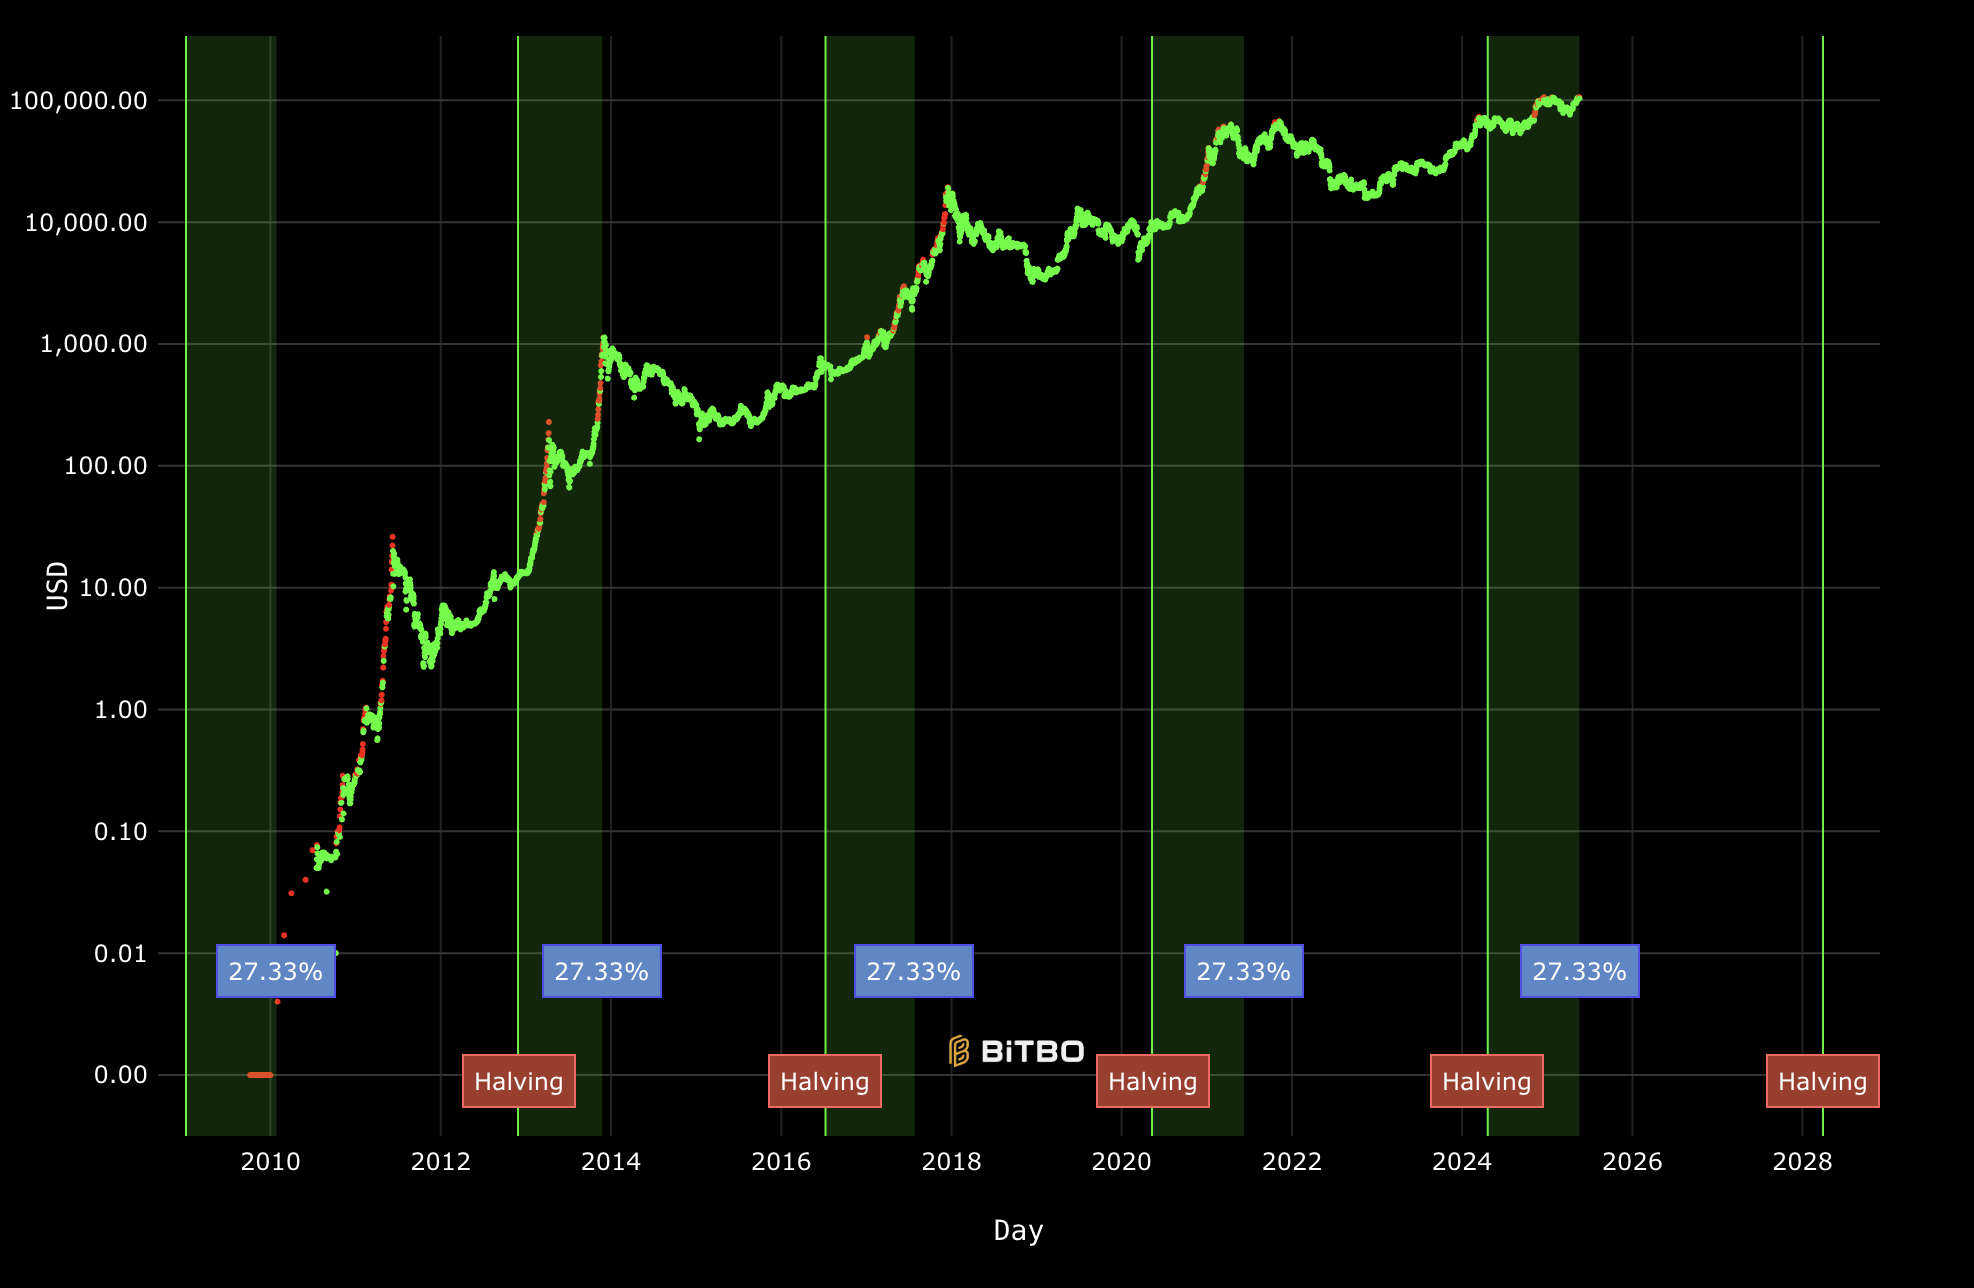
[See detailed, interactive Bitcoin price chart and halving visual at Bitget Price Chart and Bitbo Halving Progress ]
What Happens After Each Bitcoin Halving?
Each halving intensifies Bitcoin’s scarcity as fewer new coins are introduced into circulation. This supply shock, coupled with growing global adoption, tends to drive market cycles historically characterized by price rallies, miner adaptation (as older, less efficient operations retire), and heightened media focus. However, several factors modulate these effects:
-
Market Sentiment: Investor confidence can accelerate post-halving rallies.
-
Macroeconomic Events: Global crises or liquidity changes can mute or inflate responses.
-
Institutional Flows: ETF approval and corporate adoption play expanding roles.
-
Mining Economics: Hashrate and energy costs can cause miner shakeouts, impacting network health.
Over time, halving events have less effect on absolute Bitcoin emission but greater psychological and narrative power, continuing to define Bitcoin’s investment story.
Conclusion
Bitcoin halving is a cornerstone of Bitcoin economics, steadily reducing supply and shaping price discovery and market cycles. Studying the detailed timeline, stats, and price movements of the 2012, 2016, 2020, and 2024 halvings offers invaluable insight for investors. As we approach the 2028 halving, understanding historical behavior — along with evolving institutional and regulatory developments — will be crucial for anyone navigating the crypto investment landscape.
This article is for informational purposes only and does not constitute investment advice. Please consult financial experts before making cryptocurrency investments.

- Introduction
- What Is Bitcoin Halving?
- The Timeline of Bitcoin Halvings: From 2009 to 2028
- Bitcoin Halving History: An In-Depth Review
- Bitcoin Halving Price Chart, Timeline, and Market Trends
- What Happens After Each Bitcoin Halving?
- Conclusion