FET Retesting Its Broadening Wedge Breakout: Is a Bounceback Ahead?

Date: Wed, May 07, 2025 | 03:35 PM GMT
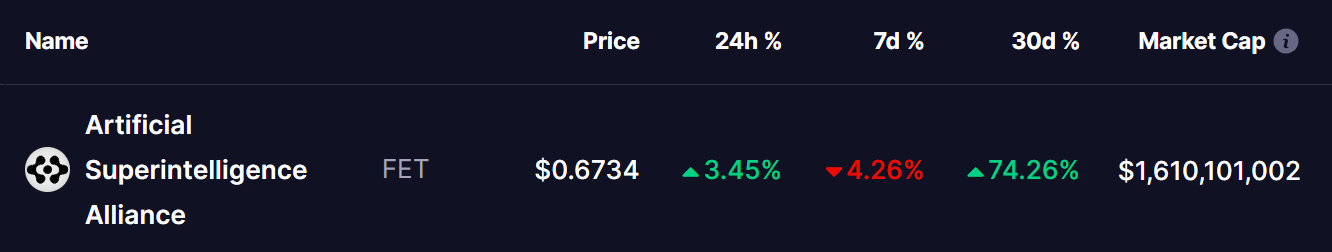
After a shaky start to 2025, the crypto market is finally showing signs of recovery. Ethereum (ETH) has rallied nearly 31% since hitting its April 9 low—and it’s not alone. Artificial Superintelligence Alliance (FET), a leading AI-focused token, has surged over 74% in the last 30 days, drawing attention from traders and analysts alike.
While weekly gains have cooled slightly in weekly performance, FET is back in the green today. And based on its recent price action by crypto chart analyst @JohncyCrypto , it could be gearing up for another bullish push—especially after retesting a major breakout zone.
 Source: Coinmarketcap
Retesting Its Broadening Wedge Breakout
On the daily chart, FET had been trading within a well-defined broadening wedge pattern for several months. The token dropped from a January 6 high around $1.65 all the way down to a low of $0.34 on April 7. The pattern reflected sustained bearish pressure, with lower highs and lower lows within a widening structure.
But that trend changed on April 24, when FET decisively broke out of the wedge around $0.62, flipping former descending resistance into support. The breakout was followed by a strong push toward $0.806, before price action began to cool.
Now, FET is retesting the broken resistance line, a textbook move in technical analysis that often sets the stage for a continuation of the breakout move. Adding confidence to the setup, the token is also finding support from its 100-day moving average (MA 100), currently hovering near $0.63.
Upside Targets: What’s Next for FET?
If FET maintains this support zone and confirms a bounce, analysts have outlined several upside targets:
- $0.81 – Near the recent local high and a key volume resistance level
- $1.13 – A significant mid-range resistance from earlier in the year
- $1.60 – The upper bound of the major resistance zone and former January high
A full move to $1.60 would mark a massive 135% gain from the current level of around $0.67.
The Volume Profile indicator also shows that once FET clears the $0.81 resistance, the path to higher levels could become less obstructed, thanks to lower volume overhead.
Is a Bounceback Ahead?
Technically, the setup looks favorable. The breakout from the wedge, the retest of former resistance, and support at the MA 100 all point to bullish momentum building. The Relative Strength Index (RSI) remains healthy and far from overbought territory, which supports further upside potential.
However, traders should still watch closely for confirmation. Holding above the $0.60–$0.62 zone over the coming sessions will be key to validating the breakout and triggering a fresh leg higher.
Disclaimer: This article is for informational purposes only and does not constitute financial advice. Always conduct your own research before investing in cryptocurrencies
Disclaimer: The content of this article solely reflects the author's opinion and does not represent the platform in any capacity. This article is not intended to serve as a reference for making investment decisions.
You may also like
Bitcoin Price Today, 08/05/2025: BTC Aims for $110K in the Coming Days

Bitcoin’s Potential Breakout Following Bullish Market Insights

Bitcoin Approaches $100K Amid $294M Crypto Liquidations

Solana Holds Momentum, Litecoin ETF Buzz Grows, While BlockDAG Joins Top Crypto Performers with $229M Presale Surge