

Date: Fri, May 16, 2025 | 04:50 AM GMT
The cryptocurrency market is showing strong signs of recovery, with Ethereum (ETH) continuing to lead the charge. ETH has climbed over 62% in the past month and is now trading near the $2,550 mark — its highest level in months. This upward momentum is lifting investor sentiment across major altcoins , including Hedera (HBAR).
HBAR has recorded gains of over 26% this month, but its recent pullback is drawing attention. The token is now retesting a key breakout level, raising the possibility of a strong bounce back — or a deeper correction.
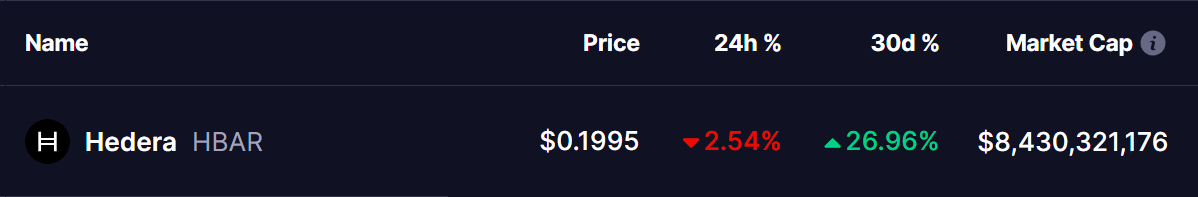 Source: Coinmarketcap
Retesting Inverse Head and Shoulders Breakout
On the daily timeframe, HBAR has formed a classic inverse head and shoulders pattern, a bullish reversal formation that often signals the end of a downtrend and the beginning of a new upward phase.
The pattern was confirmed when HBAR rallied from the right shoulder near $0.169 and broke through the neckline resistance at $0.20. This breakout was supported by the 100-day moving average and sent the price as high as $0.2286.
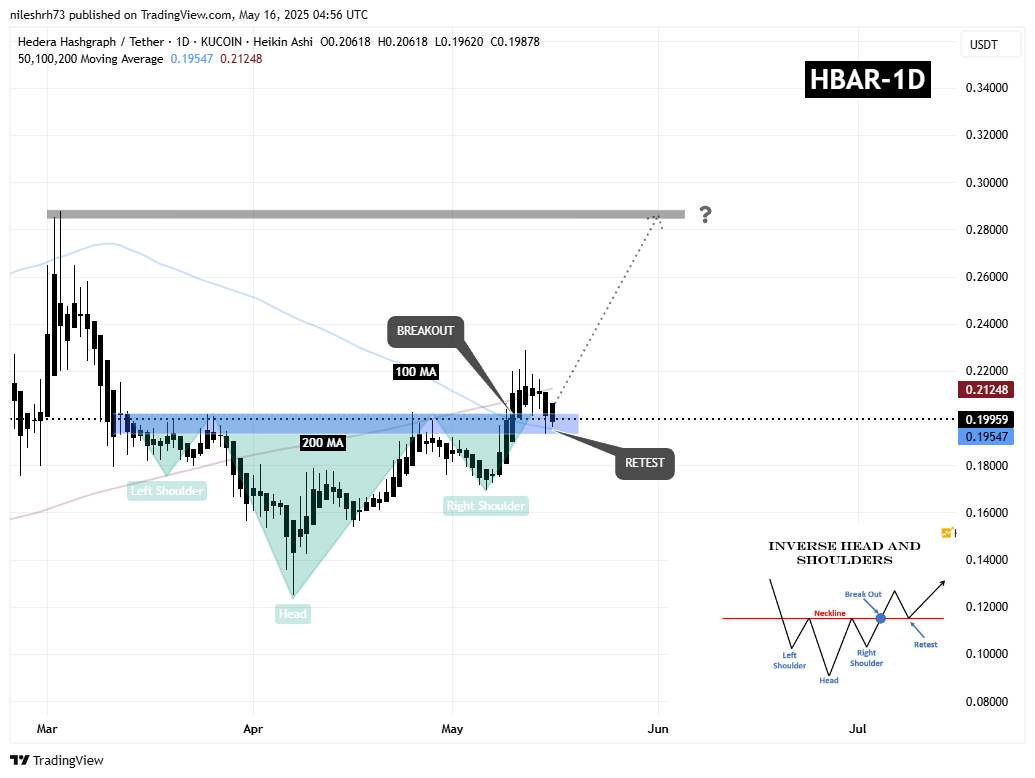 Hedera (HBAR) Daily Chart/Coinsprobe (Source: Tradingview)
However, after hitting that level, HBAR faced strong selling pressure and retraced more than 15%, pulling back to the $0.20 zone. This area, which previously acted as resistance, is now being retested as support. Both the 100-day and 200-day moving averages are in close proximity, providing additional technical reinforcement.
What’s Next for HBAR?
The price region between $0.19 and $0.20 is now critical for HBAR’s next move. If the token holds above this support zone and attracts renewed buying interest, it would confirm the validity of the breakout. In that case, the technical projection from the inverse head and shoulders pattern points to a potential target of $0.2876, offering a 45% upside from current levels.
On the other hand, if HBAR fails to maintain its position above the neckline and closes below this range, the breakout could be invalidated. This scenario would increase the risk of a further decline, possibly dragging the price back toward the $0.18–$0.17 range before any significant recovery can occur.
Whether HBAR can sustain its current structure and rebound from this key level may depend heavily on broader market sentiment. Ethereum’s continued strength could play a major role in lifting HBAR and other altcoins in the coming days.
Disclaimer: This article is for informational purposes only and not financial advice. Always conduct your own research before investing in cryptocurrencies.