

The PEPE price today is hovering around $0.00001285, slipping nearly 7.5% over the last 24 hours after facing a sharp intraday rejection near the $0.00001390 level. This move follows a volatile rally earlier this week that had pushed the meme coin above $0.000014 before sellers stepped in aggressively. Despite the strong upside momentum seen from May 7 to May 13, PEPE price action now signals rising hesitation from bulls as multiple resistance zones converge near the highs.
What’s Happening with PEPE’s Price?
 PEPE price dynamics (Source: TradingView)
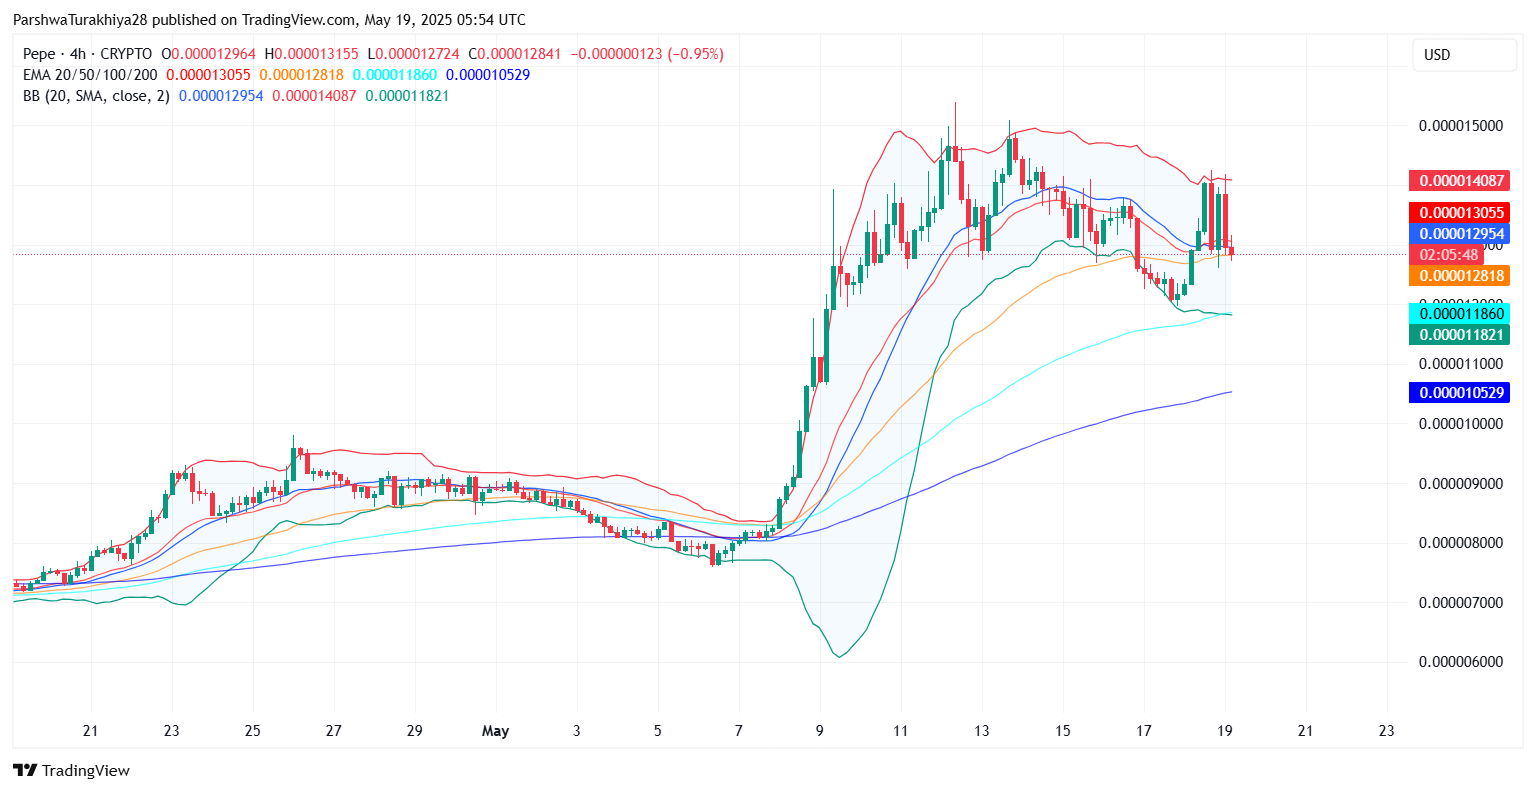
On the 4-hour chart, PEPE price is trading within a newly forming symmetrical triangle after breaking out of an earlier bullish channel. The recent rejection near $0.00001424 aligns with a horizontal supply band and descending trendline from the May 13 peak. While short-term momentum has cooled, the broader structure remains intact as long as the $0.00001270 support zone holds.
 PEPE price dynamics (Source: TradingView)
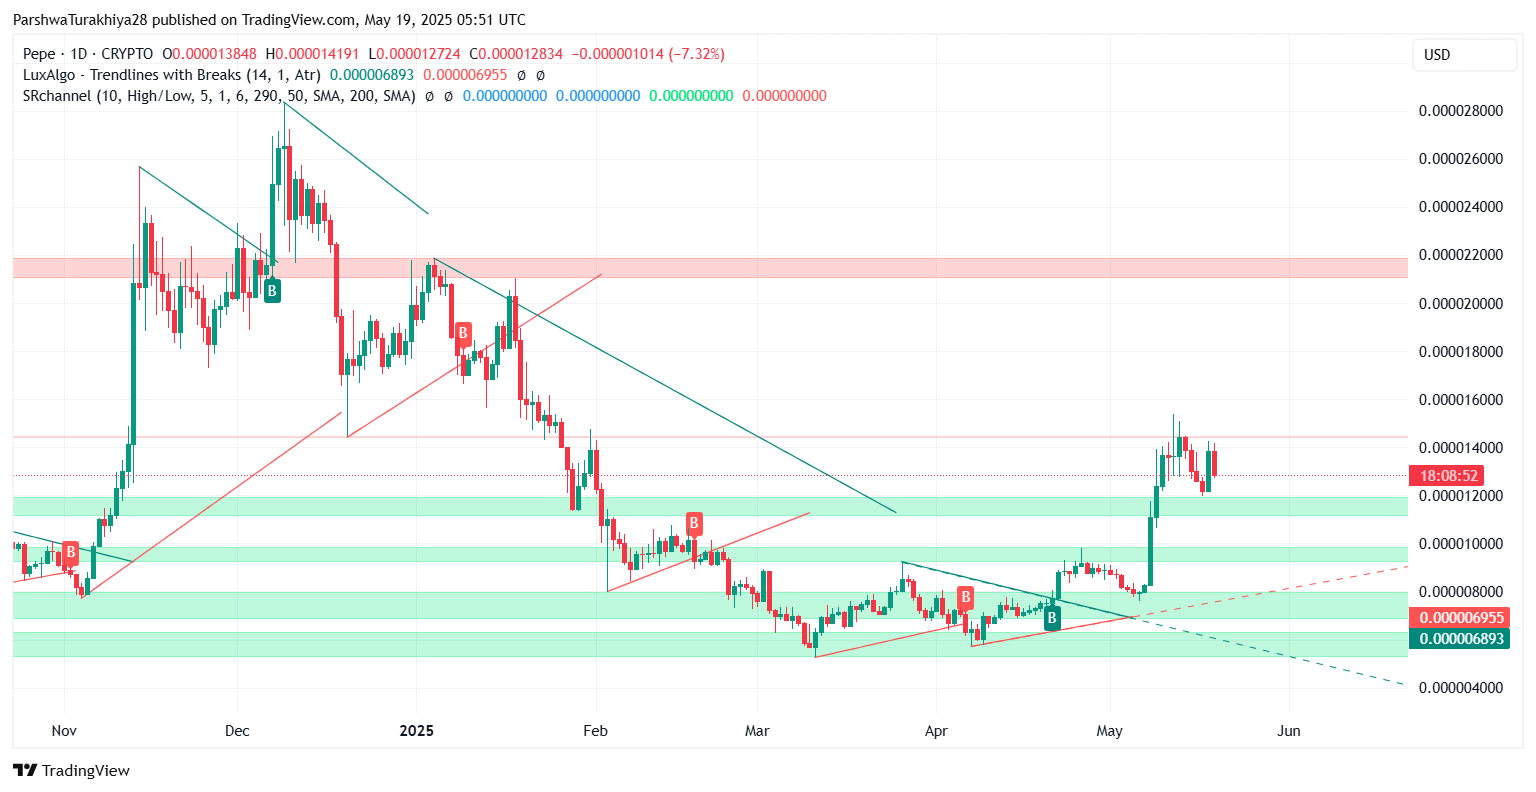
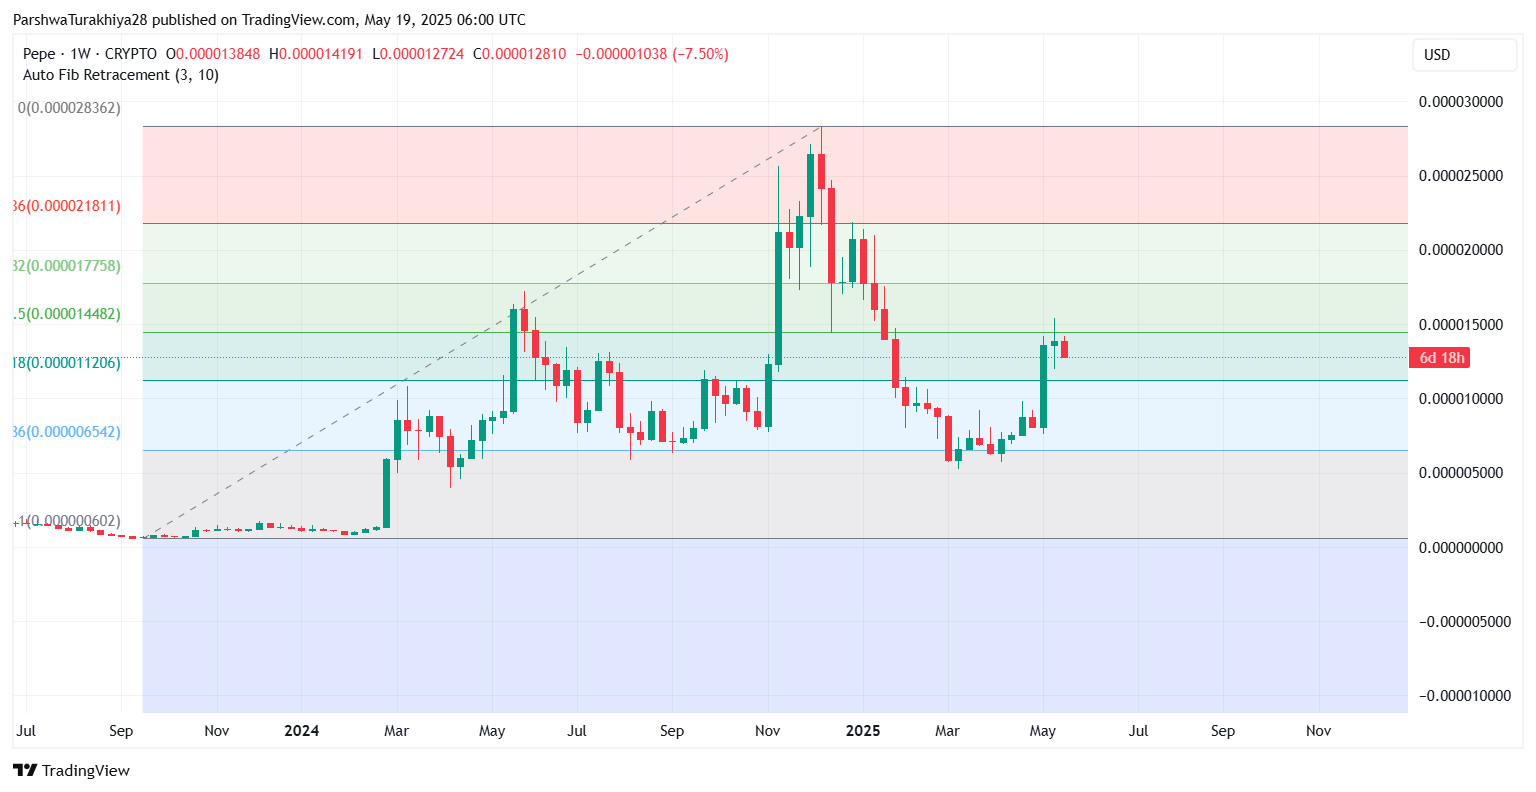
Looking at the daily chart, PEPE is consolidating just below the weekly 50% Fibonacci retracement level around $0.00001448, which acts as a medium-term pivot for directional bias. A decisive close above this level could reignite bullish momentum toward $0.00001775 and $0.00002181, both historical rejection points from late 2024.
Why PEPE Price Going Down Today?
 PEPE price dynamics (Source: TradingView)
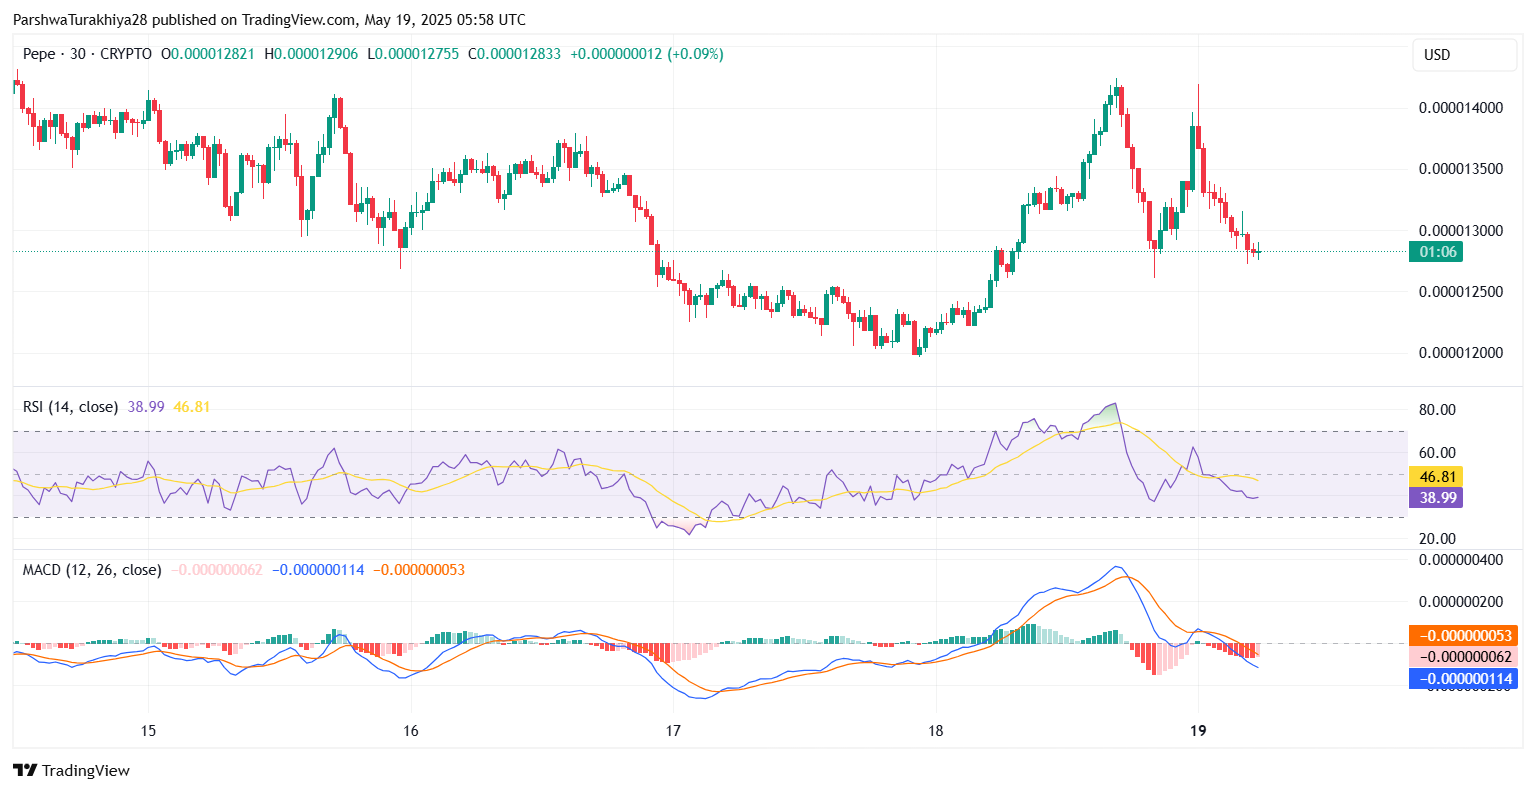
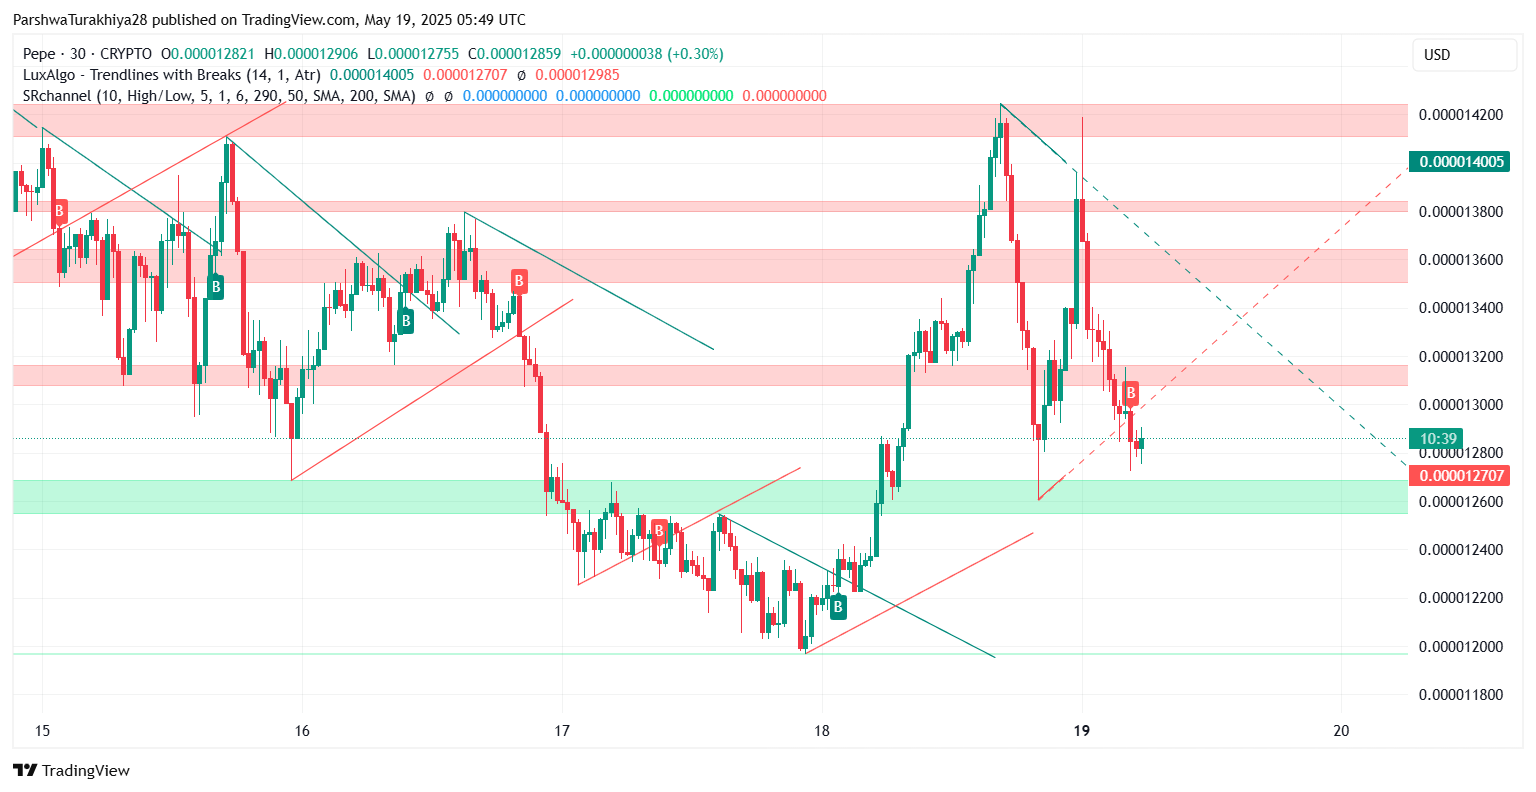
The current PEPE price update shows clear evidence of short-term bearish divergence. On the 30-minute chart, RSI has dipped to 38.99, moving below the neutral 50 mark, while MACD has shifted into a mild bearish crossover. These signals reflect waning momentum following an overheated rally earlier in the week.
 PEPE price dynamics (Source: TradingView)
The Bollinger Bands on the 4-hour chart are starting to compress again, suggesting PEPE price volatility is entering a contraction phase. Historically, this type of compression has preceded major breakout moves. Whether the next leg is higher or lower depends on the defense of the $0.00001270 level, which also marks the lower Bollinger Band and EMA20 convergence.
 PEPE price dynamics (Source: TradingView)
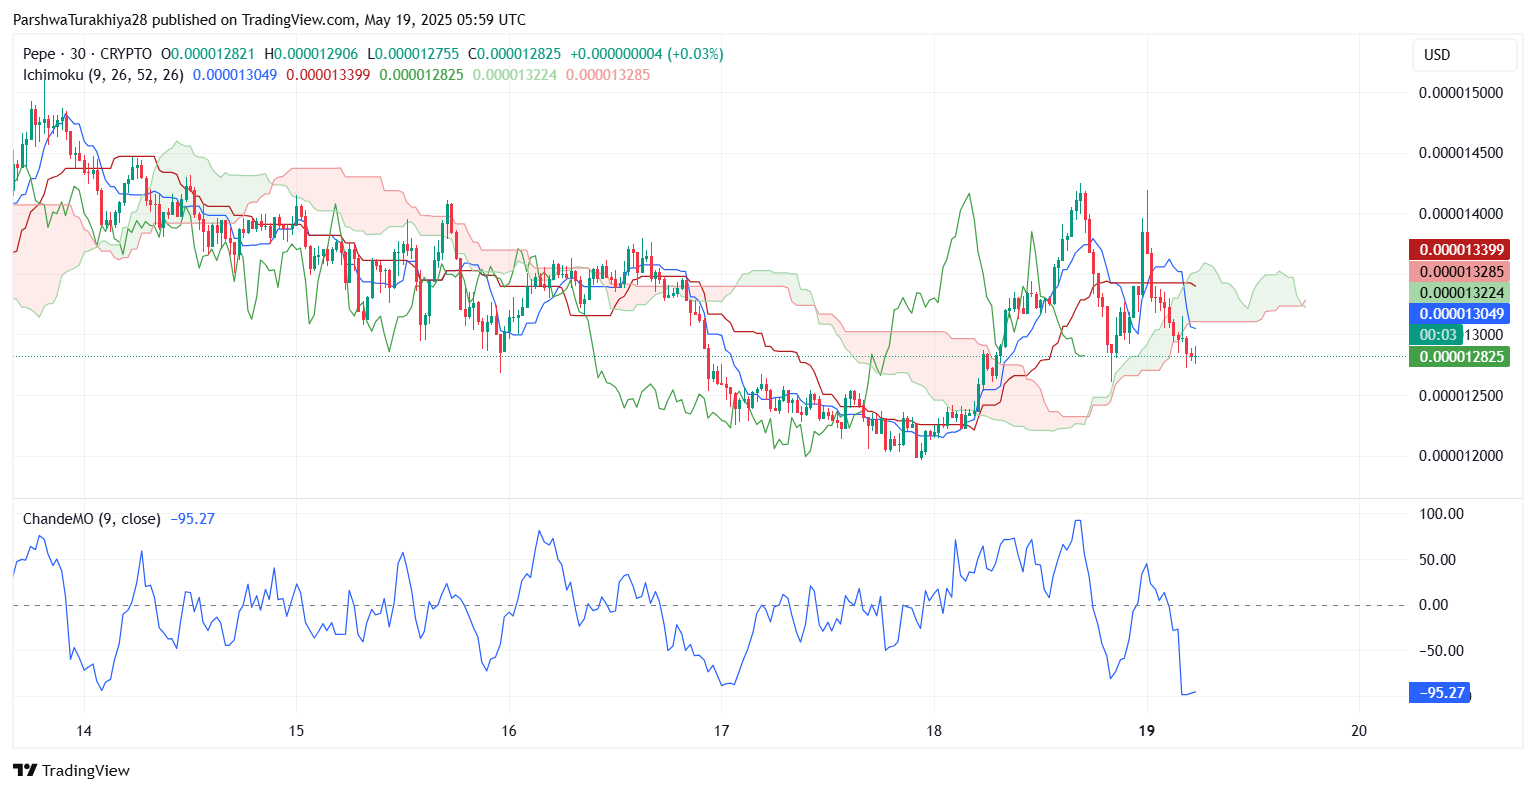
Ichimoku Cloud analysis on the 30-min chart adds further caution. Price has slipped inside the cloud with the Tenkan-Sen crossing below the Kijun-Sen — a weakening short-term trend signal. The Chikou Span is also dipping beneath the candle body structure, hinting at loss of buyer strength.
PEPE Price Action Holding Key Support Zone
 PEPE price dynamics (Source: TradingView)
Despite the recent dip, PEPE price action continues to respect its rising trendline support from early May. This trendline intersects the $0.00001270–$0.00001280 zone, making it crucial for bulls to hold. A breakdown from this level could invite a retest of deeper support around $0.00001186, where the 100 EMA sits, followed by $0.00001052, the 200 EMA on the 4H chart.
Zooming out, the weekly chart shows PEPE respecting the 0.618 Fib level near $0.00001120, which may act as a long-term base. As long as bulls defend this band, the uptrend that began in April may still have legs going into late May.
Short-Term Outlook: Will Bulls Regain $0.00001320?
 PEPE price dynamics (Source: TradingView)
For a bullish reversal to materialize, PEPE must reclaim the $0.00001320–$0.00001355 range with volume. This area has repeatedly rejected price since May 17 and marks the neckline of the current triangle pattern. If broken, it could trigger a fresh breakout targeting $0.00001420 and beyond.
On the flip side, a failure to hold $0.00001270 could shift the momentum decisively in favor of bears, potentially dragging PEPE price back to its 200 EMA zone or even toward the Fib base near $0.00001120.
Given the flattening MACD, declining RSI, and tightening Bollinger Bands, a major move is likely to unfold over the next 24–48 hours. Traders should monitor volume closely and watch for confirmation at the triangle apex and EMA cross zones.
PEPE Forecast Table: May 20
| Indicator/Zone | Level / Signal |
| Resistance 1 | 0.00001355 |
| Resistance 2 | 0.00001420 |
| Support 1 | 0.00001270 |
| Support 2 | 0.00001186 |
| 200 EMA (4H) | 0.00001052 |
| RSI (30-min) | 38.99 (Bearish Bias) |
| MACD (30-min) | Bearish Crossover |
| Bollinger Band Width | Narrow Range, Likely Expansion |
| Ichimoku Status | Price Inside Cloud, Weak Bias |
Disclaimer: The information presented in this article is for informational and educational purposes only. The article does not constitute financial advice or advice of any kind. Coin Edition is not responsible for any losses incurred as a result of the utilization of content, products, or services mentioned. Readers are advised to exercise caution before taking any action related to the company.