Week 23 On-Chain Data: How ETFs and On-Chain Whales Are Redefining BTC's Supply and Demand Dynamics?

In the short term, the overall market sentiment remains relatively neutral and cautious, with no signs of either euphoria or panic.
Original Title: "Silent Buyers: How ETFs and On-Chain Whales Are Redefining the BTC Supply and Demand Dynamics?|WTR 6.16"
Source: WTR Research Institute
Weekly Review
This week, from June 9 to June 16, the price of Ice Tangerine ranged between a high of approximately $110,530 and a low of nearly $102,664, marking a volatility of around 7.12%. By examining the distribution chart of tokens, it is observed that a significant volume of transactions occurred near $103,876, which could serve as potential support or resistance.
• Analysis:
1. 60,000–68,000: approximately 1.2 million tokens traded;
2. 76,000–89,000: approximately 1.24 million tokens traded;
3. 90,000–100,000: approximately 1.4 million tokens traded;
• In the short term, the probability of the price not dropping below the 95,000–100,000 range is 80%.
Key Updates
Economic Updates
Market Open Performance:
• On Monday, U.S. stock indices opened higher. Nasdaq rose 1.6% intraday, while the S&P 500 gained 1.06%.
• Gold fell by 1%, Brent crude oil dropped by 2%, and the U.S. Dollar Index decreased by 0.17%.
Fed (FOMC) Updates and Rate Cut Expectations:
• This Thursday at 2:00 AM, the Federal Reserve's FOMC will announce its rate decision and economic projections.
• Due to weaker-than-expected CPI (Consumer Price Index) and PPI (Producer Price Index) data recently, the market has moved up its expectations for the next rate cut, with a greater likelihood projected for September.
• Market attention is focused on whether the Fed will release clear signals about the timing of future rate cuts.
• Citigroup analysts have stated that the market might be underestimating the likelihood of a rate cut.
• Jefferies economist Mohit Kumar suggested that Fed Chair Jerome Powell might emphasize the uncertainties around economic growth and inflation outlooks. While he is likely to adopt a tone of not rushing to cut rates, he will likely hint at readiness to act if needed.
• The general market consensus expects Fed Chair Powell to maintain a neutral stance.
Geopolitical Factors and Market Impact:
• Ahead of the Federal Reserve's interest rate meeting, one of the market's focus points is the conflict between Israel and Iran.
• The ongoing tensions in the Middle East and concerns over geopolitical conflicts are putting pressure on risk assets.
Institutional Forecasts:
• Goldman Sachs maintains its forecast, predicting that gold prices will reach $3,700/oz by the end of 2025 and $4,000/oz by mid-2026. Regarding crypto ecosystem developments:
Hong Kong's Stablecoin Regulatory Progress:
• Hong Kong's Financial Secretary Paul Chan indicated that with the development of the digital asset market, demand for stablecoins is set to increase.
• The "Stablecoin Ordinance" has been passed by the Legislative Council and will come into effect on August 1.
• After the ordinance takes effect, the Hong Kong Monetary Authority (HKMA) will promptly process license applications, aiming to attract global institutions to issue stablecoins in Hong Kong according to real-world application scenarios. This is expected to enhance market liquidity and competitiveness.
• Last year, the total transaction volume of digital assets and related products through local Hong Kong banks reached HKD 17.2 billion, while the total digital assets under custody at year-end stood at HKD 5.1 billion.
Performance and Analysis of the Cryptocurrency Market:
• Circle (issuer of USDC) saw an intraday gain of 20%, with its market cap climbing to $35 billion.
• BTC rose by 2.2%, while ETH increased by 3.6%.
• QCP Analysis: Despite tensions in the Middle East, BTC has not experienced panic-driven sell-offs, demonstrating improved market resilience. Persistent institutional buying remains a key support factor.
• 10x Research Analysis: Against the backdrop of rising oil prices, steady U.S. Treasury yields, data divergences, and a cautious Federal Reserve, BTC’s macro fundamentals are quietly strengthening. The longer the consolidation phase, the greater the likelihood of a potential breakout.
• Seasonal factors in the summer might lead BTC to continue consolidating in the short term. However, medium- to long-term macro signals are turning positive, laying the groundwork for a potential rally later in the year.
• BTC Cycle Performance: The current cycle aligns with past trends—2015–2018 saw a gain of 1,076%, 2018–2022 recorded a gain of 1,007%, and the current gain since 2022 now stands at 656%.
ETF Fund Flows:
• U.S. spot BTC ETFs recorded a total inflow of $1.37 billion last week, with BlackRock's IBIT ETF accounting for $1.159 billion of that.
• U.S. spot ETH ETFs saw an inflow of $528.2 million last week.
• Spot BTC ETFs have posted net inflows for the seventh consecutive week.
• According to CoinShares data, digital assets have logged net inflows for nine consecutive weeks, with $1.9 billion flowing in last week. Total consecutive inflows in this cycle have reached $12.9 billion, and year-to-date total inflows have hit a record high of $13.2 billion.
• Bloomberg ETF analyst Eric Balchunas noted that BlackRock’s spot BTC ETF assets under management have surpassed $70 billion, achieving this milestone in just 341 days, making it the fastest ETF to reach this mark.
Corporate Holdings and On-Chain Data:
• U.S.-listed company SharpLink Gaming invested $463 million to acquire an additional 176,271 ETH, making it the public company with the largest ETH holdings.
• Japanese-listed company Metaplanet increased its holdings by 1,112 BTC, bringing its total holdings to 10,000 BTC.
• Santiment data: Currently, 6,392 addresses hold between 1,000 and 100,000 ETH. Over the past 30 days, these addresses have collectively added 1.49 million ETH, representing a growth of 3.72%.
Market Predictions and Future Catalysts:
• Cointelegraph reports: The market consensus is not bearish; the bull market has not ended. The market believes BTC is preparing to enter a new price discovery phase, with an estimated target of $170,000, with $113,000 being the only major obstacle.
• VanEck’s Head of Digital Assets, Matthew Sigel, stated: The claims by low-cap public companies about building large-scale crypto reserves can often be seen as scams, likely intended to pump their stock prices.
• Potential catalysts: A possible Federal Reserve rate cut later in the summer and the U.S. “GENIUS Stablecoin Act” could serve as opportunities to reverse the market trend.
U.S. Regulatory Developments:
• The U.S. Securities and Exchange Commission (SEC) announced four senior appointments, including two members with expertise in digital assets. This move has been interpreted as a signal that SEC Commissioner Paul Atkins takes a more crypto-friendly stance toward the industry.
Stablecoin Market Data:
• The total market capitalization of stablecoins grew by 0.63% over the past 7 days, reaching $251.542 billion.
Long-Term Insights: Used to observe our long-term positioning; bull market/bear market/structural changes/neutral state
Mid-Term Analysis: Used to analyze which phase we’re in currently, how long this phase may last, and what challenges we may face
Short-Term Monitoring: Used to analyze short-term market conditions, potential directional movements, and the likelihood of certain events occurring under specific conditions
Long-Term Insights
• Non-liquid Long-term Whales
• Total Spot Selling Pressure
• ETF Reserve Status
• Long-term Investors Holding for Over 6 Months
• Large Net Transfers on Exchanges
• Cost Basis of Short-term Speculators
Part One: In-depth Analysis of Core On-chain Data
(Below: Non-liquid Long-term Whales)

The most forward-looking and financially capable participants in these markets are currently in a prolonged and steep accumulation cycle. This is not a short-term activity but a long-term, strategic asset allocation. It indicates that the most influential capital is leveraging the current phase to systematically increase their core holdings.
(Below: Total Spot Selling Pressure)

The overall willingness to sell in the current market is at a recent low. Regardless of price movements, the holder base—whether in profit or loss—has demonstrated a significant "reluctance to sell." The urgency to sell is weak, providing the market with a solid foundational environment.
(Below: ETF Reserve Status)

ETF fund flows have transitioned from an early "explosive" influx phase to a more mature and stable "allocation-driven" net inflow stage. While daily inflow volumes have tapered off, the key point is that fund flows have not reversed and continue to maintain an overall net inflow or balance. This represents a persistent wave of purchasing power originating from traditional financial markets.
(Below: Long-term Investors Holding for Over 6 Months)

This is the most macro and structurally significant indicator. Over 53.5% of the supply has been locked by long-term holders, and this figure continues to climb rapidly. This fundamentally alters the market's supply structure, with a significant number of tokens leaving the short-term liquidity market and entering a "quasi-inventory" state, continuously reducing the effective supply available for trade.
(Below: Large Net Transfers on Exchanges)

Recent data indicates that large transactions primarily exhibit net outflows. This is a clear signal showing that large-scale investors tend to transfer assets from trading platforms to private wallets after purchasing. The motive behind this behavior is long-term storage rather than short-term trading, directly reducing the available spot inventory for sale on trading platforms.
(Chart below: Cost basis for short-term speculators)

1. The cost basis at $98,245 serves as the psychological breakeven line for recent market-active capital. It acts as a "Maginot Line" for short-term market sentiment—a price above this level suggests relative market safety; however, if breached, it may trigger stop-loss behavior among short-term traders.
Part Two: Deep Integration Analysis
On the surface, the market appears to be a battleground between macro uncertainties and strong micro-level data. Traders are intently watching the Federal Reserve's moves, as if the market's fate hangs by a thread. The narrow price fluctuations intensify this "calm before the storm" tension. But stepping back reveals a profound paradox: if macroeconomic headwinds are so severe, why do the market's internal "vital signs" appear so robust and healthy? Long-term holders are increasing, whales are accumulating, and selling pressure is declining.
This suggests that the market's internal dynamics are undergoing some profound changes, making it more resilient to external "weather conditions." The real story may not be about the weather but about the strength of the underlying ecosystem itself. To understand these internal changes, we can borrow the metaphor of "geological plates" and integrate all available data into this paradigm. The crypto asset market, much like a continent, is undergoing fundamental changes in its "geological composition." The core driving force behind this "tectonic shift" is the sustained growth of "long-term investors," the chief architects of this evolution. Over half of the landscape has transitioned from loose, easily eroded "quicksand" into solid "bedrock." The details of this project are becoming increasingly clear:
• "Illiquid long-term whales" and "ETFs" are the two primary construction teams. The former functions as an internal tectonic force, compressing and solidifying the landmass from within, while the latter acts like an external land reclamation project, continuously bringing new and stable materials to the continent.
• "Large net outflows from exchanges" serve as the construction logs, documenting the process of "bedrock" materials (tokens) being extracted from the liquid "ocean of markets" and permanently anchored onto the continental plate.
• The result of this tectonic shift is a significant enhancement of the continent's stability. The reduction in "overall spot selling pressure" is akin to a meteorological report indicating that even if storms (macro headwinds) occur, they are less likely to stir up a sandstorm as they did in the past because most of the sand has solidified into rock.
On this increasingly solid bedrock continent lies a thin, fluid topsoil. The "average elevation" of this topsoil represents the cost basis of "short-term speculators," situated at $98,245. The macro "tides"—primarily the Federal Reserve's monetary policy—impact this topsoil, carving out the daily price fluctuations. With this, the full picture becomes clear. The surface tensions in the market are just the natural phenomena created by macro tides eroding an ever-expanding and increasingly solid landmass. Anxiety arises because people overly focus on the fluctuations of the tide while ignoring the profound, enduring uplift of the continent beneath their feet. This isn't a fragile tug-of-war, but rather the interaction between cyclical natural phenomena (macro cycles) and structural geological evolution (ownership transfer).
The market's response patterns have consequently shifted: it has developed stronger resistance to the erosion of negative tides (macro headwinds) because most of the land is now bedrock. Meanwhile, it may exhibit sharper, more pronounced waves in the face of positive tides (macro tailwinds) due to the narrowing of river channels (liquidity constraints).
Part 3: Outlook
Short-Term Outlook:
In the short term, the focus remains on the "tides." The Federal Reserve's decisions are the largest variable, directly determining the height of the waters and triggering price fluctuations. The "$98,245 shoreline" will be a critical observation point, with the market likely to repeatedly test this level. Any macro headwinds may cause prices to temporarily dip below this line, but this should be seen as an opportunity to assess the strength of the "bedrock" support.
Mid-to-Long-Term Outlook:
The core of the mid-to-long-term outlook is the "geological movement" itself. We must continually measure the rate of bedrock thickening—such as the proportion of long-term investors, the sustainability of ETF inflows, and the dynamic accumulation patterns of whales. As long as this movement continues, the boundaries of the continent will expand, and the market's foundational value will deepen. When the next macro tailwind's "great tide" arrives, it will lift a value entity far larger and more stable than in the past.
Mid-Term Observations
• Liquidity supply levels
• Comprehensive whale purchasing power score
• Net futures positioning trends on BTC trading platforms
• Incremental models
• Global purchasing power
• On-chain total token distribution structure
(Chart: Liquidity Supply Levels)

The newly generated liquidity supply in the current market has declined, suggesting that the market still leans toward a structural dynamic of range-bound oscillation. If this state persists, the market may continue gliding within the current framework, requiring more time to establish broader directions. From another perspective, participants may also be engaging in observation and iterative deliberation as they navigate this period of strategic positioning.
(Below diagram: Comprehensive Whale Score)

The whales continue to maintain a robust supply of liquidity, indicating that large-scale participants in the market are still actively engaged in the ongoing competition. Due to the decline in new liquidity supply, the current market's whales lean towards a stock (existing) status. These stock whales are the main contributors to BTC's current high-level oscillation trend.
(Below diagram: BTC Exchange Net Position Trend)
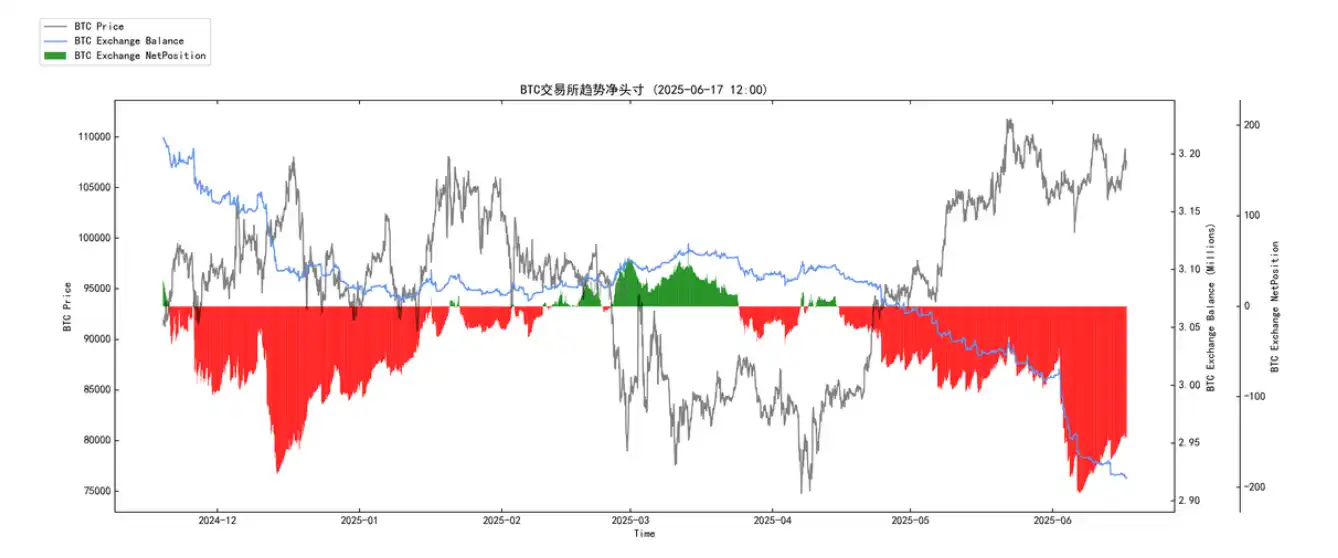
BTC is still undergoing accumulation activity on exchanges. At this stage, it remains in a state of weak accumulation, with a small amount of BTC flowing out of the exchanges.
(Below diagram: Incremental Model)

The supply from short-term participants continues to decline, and the market's rally, which began in April 2025, is still driven by stock liquidity. As highlighted in previous weekly reports, the continuous buying by existing market participants, combined with the increasing volume of short liquidations, has now pushed the market to higher levels. If the incremental liquidity remains in its current state, the likelihood of a major breakout in the near term will continue to diminish. The market requires more time for further competition, and many participants might be waiting for a pivotal moment to spark a trend reversal.
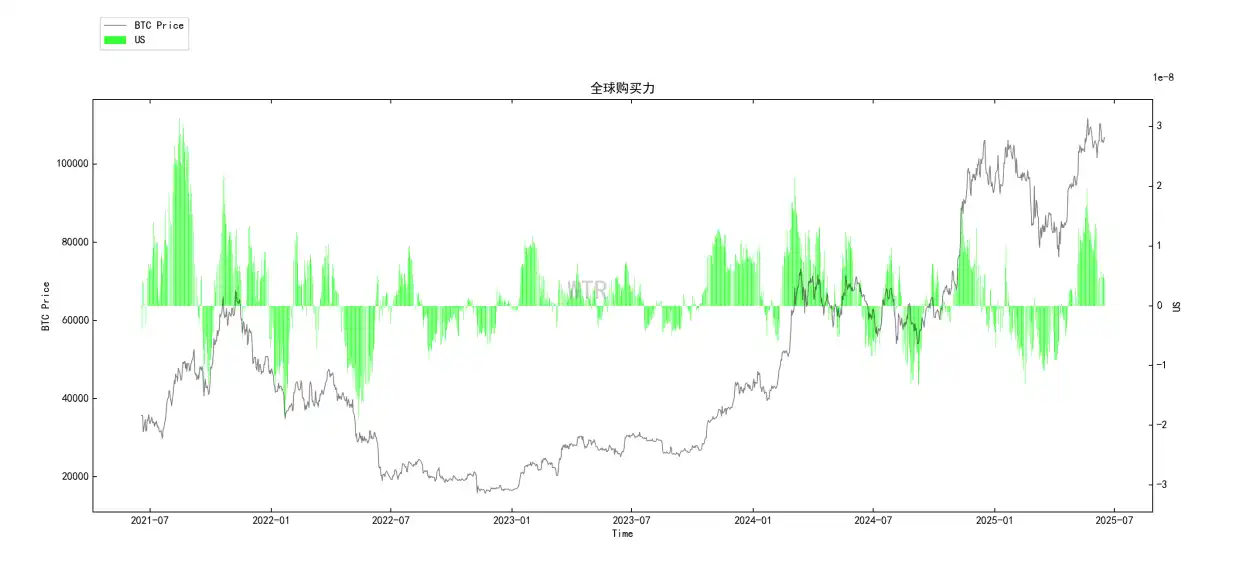
(Below diagram: Global Purchasing Power)

Global purchasing power is currently in decline. As purchasing power gradually contracts, the market appears to be returning to a state of rationality and calmness.
(Below diagram: Total On-Chain Token Distribution)

From the perspective of token transaction structure, the current support level within the oscillation pattern is around 102,000. Additionally, due to lower trading volumes around 110,500, the absence of sustained incremental supply could mean that the upward momentum in price will weaken as it approaches and surpasses the 110,500 level.
Short-Term Observation
• Derivatives Risk Coefficient
• Options Intent-to-Fill Ratio
• Derivatives Trading Volume
• Options Implied Volatility
• PnL Transfer Volume
• New Addresses and Active Addresses
• BingTangOrange Exchange Net Position
• YiTai Exchange Net Position
• High-weight Selling Pressure
• Global Purchasing Power Status
• Stablecoin Exchange Net Position
Derivatives Rating: Risk coefficient is in the red zone, indicating high derivatives risk.
(Chart below: Derivatives Risk Coefficient)

The derivatives risk coefficient has once again entered the red zone. This week, solely from the perspective of derivatives, the probability of the market remaining volatile is higher. Even in the event of a short squeeze, the magnitude is likely to be much smaller.
(Chart below: Options Intent-to-Fill Ratio)
The ratio of put options and trading volume has increased and is currently at a high level.
(Chart below: Derivatives Trading Volume)

Derivatives trading volume is at a low level.
(Chart below: Options Implied Volatility)

Options implied volatility has shown only minor short-term fluctuations.
Sentiment Rating: Neutral
(Chart below: PnL Transfer Volume)

Consistent with last week, the overall market sentiment remains relatively neutral and cautious.
(Chart below: New Addresses and Active Addresses)

New and active addresses are at a medium-to-low level.
Spot Market and Selling Pressure Structure Rating: BTC continues to experience significant net outflows, while ETH sees minor outflows.
(Below: Net Flow of Bingtang Orange Trading Platform)

Currently, there are significant outflows of BTC.
(Below: Net Flow of Ether Trading Platform)

As the price of ETH rebounds, there has been a slight inflow of ETH into trading platforms. This has now been digested, turning into a slight outflow.
(Below: High-Weight Sell Pressure)

Currently, there is no high-weight sell pressure.
Purchase Power Rating: Global purchasing power has slightly declined, while stablecoin purchasing power remains steady compared to last week.
(Below: Global Purchasing Power Status)
Global purchasing power has slightly declined but remains in positive territory.
(Below: USDT Trading Platform Net Flow)

Stablecoin purchasing power remains unchanged compared to last week.
Weekly Summary:
Market Sentiment Summary:
For the current market, the most straightforward observation is that it is in a state of pent-up anticipation. All eyes are on the Federal Reserve's decision early Thursday morning, awaiting a signal regarding the future direction of interest rates. The short-term fluctuations in gold, crude oil, stocks, and even crypto assets seem to be either preemptive bets on this signal or risk hedges against it. This is a simple, clear fact and serves as the starting point for discussions.
Of course, an important question arises. If the definitive factor for the market is solely macro monetary policy, then under the relatively clear tightening expectations and geopolitical tensions in recent times, why has Bitcoin, as a representative of digital assets, not experienced a catastrophic crash? The data we see, in contrast, shows that it has demonstrated resilience that is markedly different from past cycles. This indicates that the most straightforward answer may not be complete. There must be some kind of force counterbalancing the macro pressures. This means we need to shift our focus away from the surface and explore the structural changes occurring within the market.
To understand this new force, let’s use a metaphor: imagine the entire digital asset market as a massive reservoir, with its water level representing asset prices. In the past, this reservoir’s water supply primarily depended on natural rainfall—akin to retail capital and market sentiment. Good weather (optimistic market sentiment, loose macro policies) brought abundant rain, causing water levels to rise; bad weather (market panic, tight macro policies) resulted in reduced rainfall or even drought, causing water levels to drop. Consequently, the reservoir's water level was highly sensitive to "weather conditions."
Now, however, the situation has fundamentally changed. Beside the reservoir, a massive, sturdy, and steady inflow canal has been built. This canal represents the spot ETFs pioneered by institutions like BlackRock. It operates independently of short-term weather fluctuations, continuously injecting clean water into the reservoir according to a predefined engineering design. The news reports mentioning “seven consecutive weeks of net inflows” and “year-to-date record-breaking inflows” are direct evidence of this canal operating efficiently. At the same time, actions like corporations converting parts of their balance sheets into Bitcoin or large on-chain holders steadily increasing their positions can be seen as additional deep wells constantly replenishing the water supply beyond the canal. Now, let’s look again at the water level in the reservoir. External "weather" (such as Federal Reserve rate decisions or geopolitical conflicts) is still important and governs the “evaporation rate” of the water in the reservoir.
A hawkish signal is like a blast of dry, hot wind, accelerating evaporation and putting downward pressure on the water level. Conversely, a dovish signal is akin to a timely rainstorm, helping the water level rise more quickly. Yet, the decisive factor has changed. As long as the net inflow rate of the "canal" exceeds the evaporation caused by worsening "weather" conditions over the long term, the reservoir’s water level will inevitably trend upward over time.
This is the source of the market's resilience: a consistent, structural, and non-emotional buying force (the canal) offsetting and absorbing the volatile, cyclical, and emotional macro pressures (the weather). Hence, we return to our initial observation. People are closely watching the Federal Reserve, much like farmers obsessively follow weather forecasts, and understandably so, as it directly impacts short-term yields. However, it’s not any single rainstorm that ultimately reshapes the region’s hydrological ecosystem, but rather the canal that fundamentally alters the water supply structure.
From this, we can draw a conclusion: while the market may currently react to the "mood" of the Federal Reserve in the short term, this is merely surface-level. The long-term value and stability of the market increasingly depend on its internal "structural water supply system"—namely, institutionalized and regulated capital inflow channels.
Therefore, preparing for the next phase requires a shift in analytical perspective: from over-focusing on short-term and volatile "weather forecasts" to consistently measuring the flow and health of the “canal.” Because as long as the canal’s water flow remains uninterrupted, the reservoir’s water level, even if temporarily lowered by drought, will ultimately refill and overflow, reaching even higher grounds.
Short-Term Outlook: Focus on Monetary Policy, Manage Volatility
The core theme of this phase is the uncertainty in the external macroeconomic environment. It acts like "weather," directly influencing short-term market sentiment and price fluctuations.
Key Focus:
Federal Reserve Monetary Policy: Interest rate decisions, the Summary of Economic Projections, and Chair Powell's tone in speeches are the absolute focal points for the market. Any hawkish or dovish signals will be amplified immediately.
Key Economic Data: Inflation data such as CPI (Consumer Price Index) and PPI (Producer Price Index) will directly affect market expectations for the Federal Reserve's future actions.
Market Performance:
• High volatility and range-bound consolidation: In the absence of clear macroeconomic bullish or bearish drivers, it is likely that the market will remain in a broad range of "tug-of-war," with structural buying support competing against macro-driven selling pressure.
Long-Term Outlook: Measuring "Water Flow," Capturing Trends
The core theme of this phase is the structural changes within the market. It acts like an "irrigation canal," providing continuous and stable value support to the market, shaping its long-term trajectory.
Key Focus:
• Structural fund inflows and the evolution of regulatory frameworks.
• The clarification of regulatory policies in major markets like the U.S. and Hong Kong serves as the institutional foundation to attract more mainstream funds.
Performance:
• Value floor potentially rising: Despite short-term fluctuations, over the long term, the presence of consistent net buying is likely to progressively elevate the market's value center and price floor.
On-Chain Long-Term Insights:
1. The market's core narrative is undergoing a profound and lasting shift in its ownership structure.
2. It is transitioning from a speculative market dominated by short-term liquidity to an allocation market governed by long-term value storage.
3. On-chain data comprehensively corroborates this process;
4. On the supply side, assets are being locked and fixed at an unprecedented scale, while on the demand side, a structural influx of new forces from the mainstream world has emerged.
• Market Narrative:
The current market is in the "consolidation and digestion phase" within a "structural bull market." The surface calm or fluctuations cannot obscure the ongoing internal structural strengthening. This is a phase that requires patience and a shift in analytical focus from short-term price predictions to measuring long-term structural changes.
Mid-Term On-Chain Observation:
1. Declining new liquidity leads to a market trend favoring stock (existing) market oscillation, with potential participants engaging in a wait-and-see game.
2. Whales maintain abundant liquidity supply, while stock status supports BTC's high-level consolidation.
3. BTC has weak accumulation on exchanges, with minor outflows currently detected.
4. Supply from short-term participants is shrinking, highlighting a notable stock (existing supply) structure.
5. Global purchasing power is decreasing, with the market gradually returning to a more rational and calm state.
6. Token structure indicates support levels at 102,000 and 110,500, with diminishing upward momentum above these levels.
• Market Outlook:
Stock-based Game, High-Level Oscillation
The current market mainly revolves around stock-based gameplay, likely waiting for a breakout opportunity amidst high-level oscillation.
Short-Term On-Chain Observation:
1. Risk indicators are in the red zone, reflecting high risk in derivative markets.
2. Newly active addresses are at mid-to-low levels.
3. Market sentiment rating: Neutral.
4. Exchanges show continued significant net BTC outflows, with minor ETH outflows.
5. Global purchasing power slightly declined, while stablecoin purchasing power remains at the same level as last week.
6. The probability of BTC not breaking below the 95,000–100,000 range in the short term is 80%;
• Market Outlook:
In the short term, overall market sentiment remains relatively neutral and cautious, without signs of excessive euphoria or panic. Absent significant unexpected news events, this week's market expectations remain consistent with last week's. The market, while influenced by derivatives, is likely to trend towards oscillation, with low probabilities for dramatic pullbacks or substantial short squeezes.
Risk Reminder: The above analysis is purely for market discussion and exploration, and does not constitute directional investment advice. Please approach the market cautiously and remain vigilant against black swan risks.
This article was submitted by a contributor and does not represent the views of BlockBeats.
Disclaimer: The content of this article solely reflects the author's opinion and does not represent the platform in any capacity. This article is not intended to serve as a reference for making investment decisions.
You may also like
Bitcoin Cash eyes $585, long-term target remains $1,509
Senator Lummis proposes crypto tax amendment to major US budget bill

AI crypto Block3 launches presale at $0.01, prices to jump soon