
FreeCast Stock Sinks to $1.47 as Bearish Trend Deepens Below Key EMAs

FreeCast stock (CAST) remains under firm selling pressure, closing at $1.47 on August 24 after touching a session low of $1.38. Sellers stayed active into the close, and the daily structure tells a difficult story for anyone tracking CAST right now.
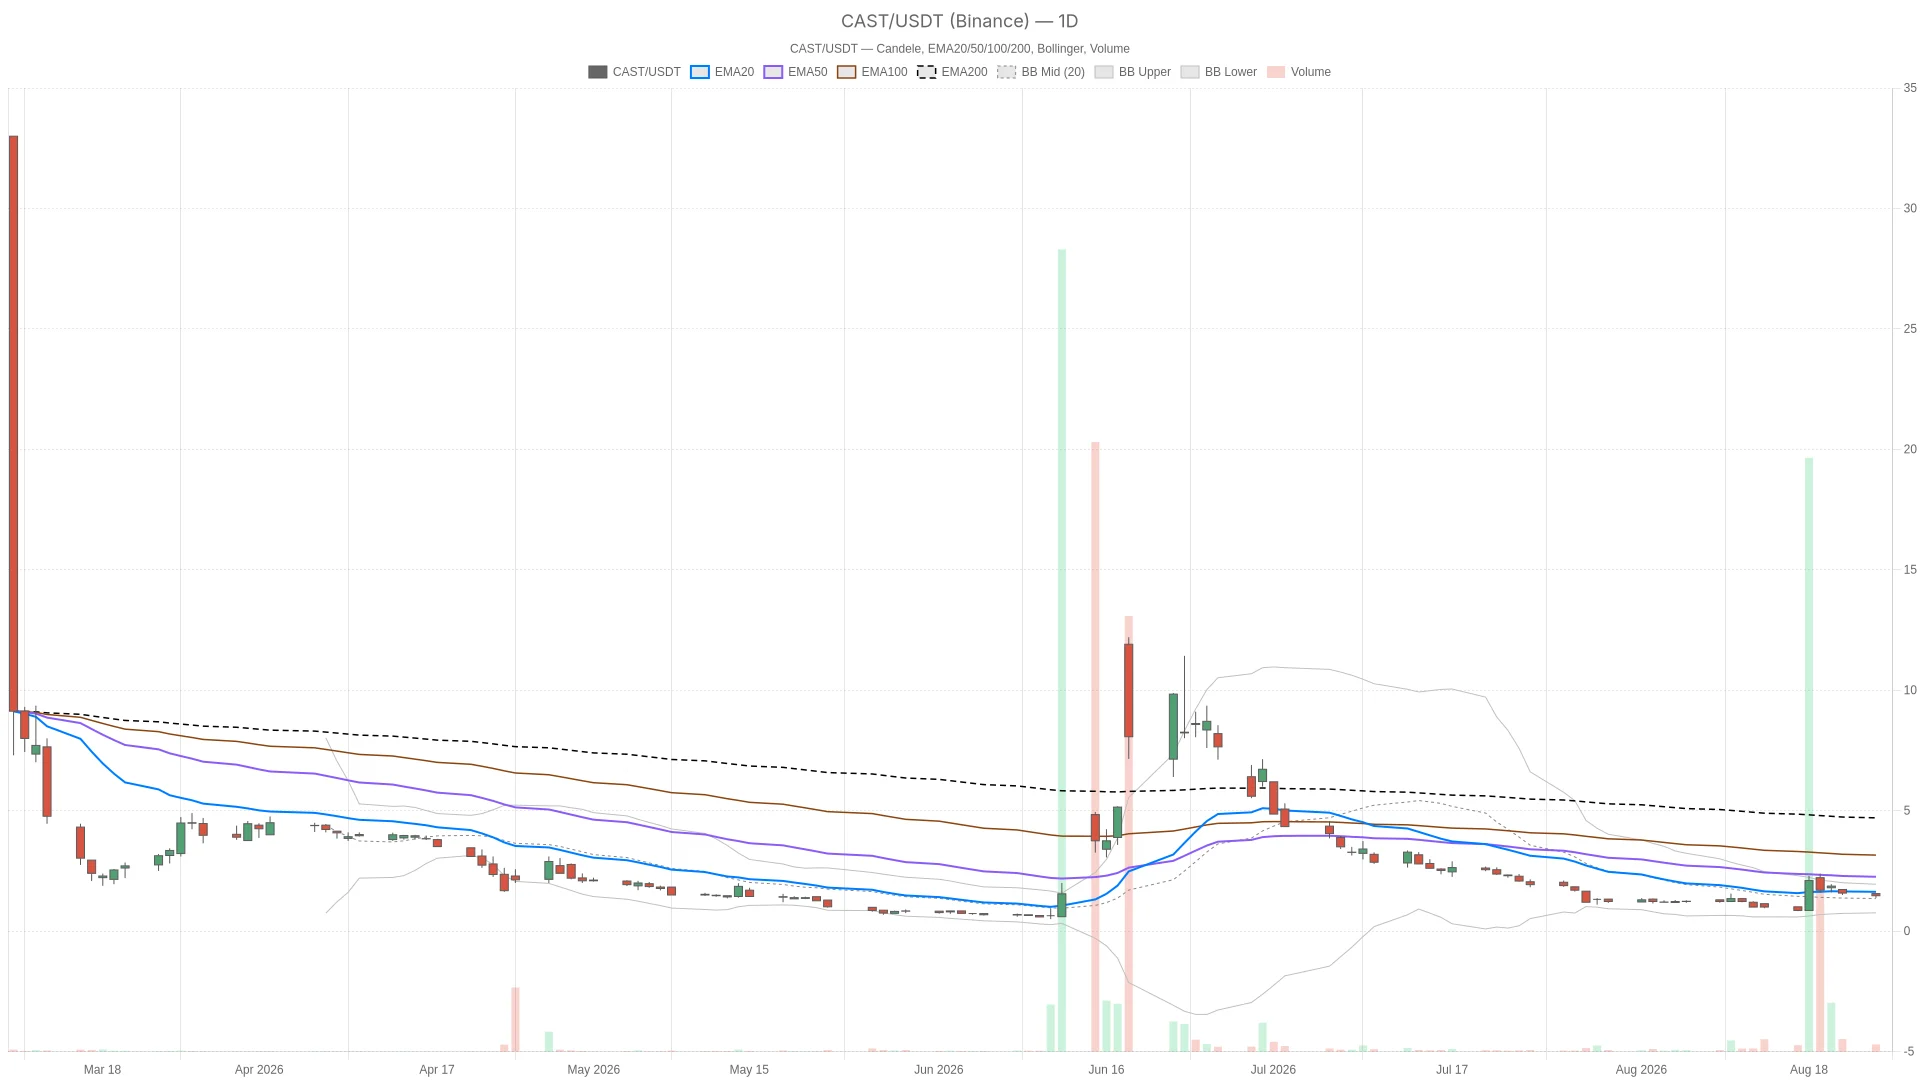 CAST — daily chart with candlesticks, EMA20/EMA50 and volume.
Summary
Key takeaways
- CAST closed at $1.47 on August 24, down from an open of $1.56 and well off the session high of $1.58.
- Daily EMA20 ($1.63), EMA50 ($2.26), and EMA200 ($4.70) all sit above price, confirming a bearish regime.
- Daily RSI14 at 45.21 signals neutral momentum — not yet oversold despite the extended decline.
- Daily ATR14 of $0.34 reflects elevated volatility relative to the $1.47 share price.
- The hourly chart shows a neutral consolidation pattern, suggesting sellers are pausing rather than pressing further.
Daily Trend Confirms Bearish Bias for FreeCast Stock
FreeCast stock’s daily trend remains firmly bearish. Price trades below every major moving average, and momentum indicators confirm that sellers still control the broader structure. The daily indicators leave little room for ambiguity. Price sits below the EMA20 at $1.63, below the EMA50 at $2.26, and well below the EMA200 at $4.70. That stacked EMA alignment points to steady medium-term losses. The system’s bearish regime tag reinforces this read. Notably, the gap between price and the EMA200 tells the real story. This is not a minor pullback — it is a deep, extended decline.
Momentum Signals: Slowing but Still Negative
RSI14 on the daily reads 45.21, which is neutral rather than oversold. That matters. It means momentum has not reached exhaustion levels, so there is no strong statistical case yet for a mean-reversion bounce. Meanwhile, the daily MACD shows the line at -0.27 against a signal of -0.41, with a histogram of +0.14. The positive histogram suggests the decline is slowing. However, with both line and signal still negative, momentum remains technically bearish. In other words, sellers are less aggressive than they were, without yet losing control.
Volatility and Pivot Context
The daily Bollinger Bands frame the volatility backdrop: mid at $1.35, upper at $1.95, lower at $0.76. Price at $1.47 sits above the midline but nowhere near the upper band. That keeps the broader read cautious rather than constructive. ATR14 stands at $0.34, a large figure relative to a $1.47 share price. That is a volatility footprint traders need to respect. Daily ranges of this magnitude can produce sharp moves in either direction. Daily pivot levels sit at pp $1.48, r1 $1.57, and s1 $1.37, with Monday’s close landing almost exactly on the pivot itself.
Hourly Chart Shows Signs of Consolidation
The hourly chart for CAST shows a neutral consolidation pattern rather than a continued selloff, though sellers still hold the structural advantage. Price closed at $1.46, still below the EMA20 ($1.56), EMA50 ($1.50), and EMA200 ($2.10). That EMA stack technically still favors sellers. However, the system classifies the H1 regime as neutral, not bearish, and that distinction is worth noting. RSI14 on H1 reads 43.65, broadly in line with the daily reading. MACD is essentially flat: line at -0.02 versus signal at +0.01, with a small negative histogram of -0.03. This is not a strong directional signal in either direction.
The H1 Bollinger setup (mid $1.62, upper $1.90, lower $1.34) has price sitting closer to the lower half of the range. That keeps pressure tilted toward sellers without confirming a breakdown. Meanwhile, the H1 pivot at $1.47 lines up almost precisely with the current price. Such alignment often signals indecision rather than conviction. Therefore, the hourly chart is best read as a pause inside the larger downtrend rather than a genuine reversal signal.
Short-Term Execution: 15-Minute Range
The 15-minute timeframe for FreeCast stock reflects a tight, choppy range. It is useful for timing entries and exits but offers no standalone directional signal. Price closed at $1.46, wedged between the EMA20 ($1.48) and EMA200 ($1.47), and below the EMA50 ($1.53). RSI14 at 43.85 mirrors the higher timeframes almost exactly. MACD shows a marginal positive histogram of +0.01. This small tick hints at short-term stabilization but carries little weight on its own. The 15m Bollinger Bands sit at mid $1.48, upper $1.55, and lower $1.40. Together with the pivot cluster around $1.47–$1.50, they confirm the stock is trading in a narrow, choppy range right now.
Bullish Scenario: What Would Change the Picture
For FreeCast stock to build a constructive case, price would need to reclaim the daily pivot at $1.48. It would then need to push through resistance near $1.57 — the daily r1. That would be the first meaningful sign that sellers are losing their grip. On top of that, the daily MACD histogram would need to keep expanding on the positive side. This would confirm that the deceleration in downside momentum is turning into genuine reversal. A daily RSI move back above 50, paired with price reclaiming the EMA20 at $1.63, would further support a shift in structure. On the fundamental side, FreeCast announced plans to relaunch the Investor News Channel on August 18. The initiative aims to create a next-generation global business and financial FAST network. If this development gains traction with investors, it could positively feed into sentiment.
Bearish Scenario: Downside Risks Remain
The bearish scenario for CAST remains the path of least resistance given the current daily regime. A rejection near the pivot zone, followed by a break below the daily s1 at $1.37, would open the door toward the lower Bollinger band. That band sits at $0.76. The wide gap between these levels reflects just how stretched this downtrend has become. On the hourly chart, a decisive break below the $1.43 support (H1 s1) would be significant. It would confirm that the current consolidation is resolving lower rather than building a base. The EMA200 readings across both daily and hourly timeframes remain far above current price. The broader trend context therefore continues to favor sellers until proven otherwise.
Closing Thoughts on FreeCast Stock Positioning
Overall, FreeCast stock is caught between a clearly bearish daily trend and a short-term consolidation on the lower timeframes. The daily EMA structure and regime tag argue for caution. At the same time, the flattening MACD histogram and neutral H1 regime suggest sellers may be pausing rather than pressing further. The elevated ATR14 reading on the daily chart is a reminder that volatility remains high. Moves in either direction could be sharp once the current range resolves. Given the mixed signals across timeframes, positioning around CAST calls for discipline. Focus should remain on the key pivot and support levels rather than conviction in either direction.
FAQ
What is the current trend for FreeCast stock?
FreeCast stock is in a firmly bearish daily trend. Price trades below the EMA20 ($1.63), EMA50 ($2.26), and EMA200 ($4.70). The system classifies the daily regime as bearish. The hourly chart shows a neutral consolidation, but this is best read as a pause within the larger downtrend — not a reversal.
What are the key support and resistance levels for CAST?
Key support sits at the daily s1 of $1.37, with the lower Bollinger band at $0.76 representing a deeper downside target. On the hourly chart, $1.43 (H1 s1) is a critical near-term level. Resistance is clustered around the daily pivot at $1.48 and the daily r1 at $1.57. The EMA20 at $1.63 represents a more significant structural resistance.
Is FreeCast stock showing any signs of a reversal?
Not yet. The daily MACD histogram has turned positive, suggesting the pace of decline is slowing. However, both the MACD line and signal remain negative. RSI14 at 45.21 is neutral — not oversold. For a genuine reversal signal, CAST would need to reclaim the EMA20 at $1.63 with RSI moving above 50 and the MACD histogram continuing to expand positively.
What recent corporate news could affect FreeCast stock?
On August 18, FreeCast announced plans to relaunch the Investor News Channel as a next-generation global business and financial FAST network. If this initiative gains traction with investors, it could positively influence sentiment around the stock.
Article produced with the assistance of artificial intelligence and reviewed by the editorial team.
Disclaimer: The content of this article solely reflects the author's opinion and does not represent the platform in any capacity. This article is not intended to serve as a reference for making investment decisions.
You may also like
Before Cook steps down, is Apple playing its final trump card?
Apple has launched new Mac mini models equipped with M6 or M5 Pro chips, as well as an upgraded Mac Studio featuring M5 Ultra or M5 Max chips. The M6 chip is Apple’s first to use the 2-nanometer process, enhancing energy efficiency and on-device AI capabilities; the M5 Ultra focuses on professional-grade high-performance computing. These two new products mark the beginning of a new product cycle, while Tim Cook will step down as CEO on September 1st, to be succeeded by John Ternus.
AI Computing Power Capital Battle Upgrades Again! Nvidia-backed "New Cloud" Lambda Plans to Raise $3 Billion to Fuel Its Computing Power Landscape and Prepare for IPO
AI cloud computing service provider Lambda is in talks for a funding round of up to $3 billion, preparing for a potential initial public offering next year.

Net Profit Decline Can't Hide Core Momentum! Bank of Montreal (BMO.US) Q3 Adjusted Profit Beats Expectations, Plans to Launch Share Buyback Program for Up to 25 Million Shares
Due to the drag from one-time items such as the sale of transportation and supplier financing businesses, Bank of Montreal reported a year-on-year decline in Q3 net profit. However, adjusted earnings per share and revenue both exceeded market expectations, and pre-provision, pre-tax profit in all business segments reached record highs. The bank also announced plans to launch a share repurchase program of up to 25 million shares in the third quarter.

Dick's Sporting Goods Lowers Full-Year Outlook Following Second-Quarter Miss
Crypto prices
More


