
An Infographic: Overview of "Pivot Points + Long/Short Position Signals" for Gold, Crude Oil, Forex, and Stock Indices on August 28, 2026

Huitong Finance, August 28—— Below is the latest in our “One Chart” series, illustrating the “pivot points + long and short position signals” for gold, crude oil, forex, and equity indices. The chart and textual interpretation are provided. Through a data comparison between the latest net long % and yesterday's updated net long % (net long % on the previous trading day), we interpret a total of 13 types of position signals, including net long expansion, net long reduction, no change in net short, net short shifting to neutral, and more. The chart displays several of these signals corresponding to actual data results.
One Chart: An overview of the "pivot points + long and short position signals" for gold, crude oil, forex, and equity indices on August 28, 2026. According to the latest data released today (Friday, August 28, 2026), as of just now, the following in this chart are in an “overbought” state (long positions over 80%): 6 instruments; and “oversold” state (long positions below 20%): 3 instruments. Among them, spot gold XAU/USD has a long position ratio of 88%, WTI OIL long ratio is 58%, EUR/USD long ratio is 37%. For changes from yesterday’s signals, as well as a detailed list, please refer to the special chart made by Huitong Finance.
Among the position change signals, there are: 8 with net long expansion, 5 with net long reduction, 8 with net short expansion, and 4 with net short reduction. For instruments with a position above 80%: spot gold XAU/USD long at 88%, S&P 500 long at 81%, Nasdaq 100 long at 80%, EUR/JPY short at 87%, EUR/AUD long at 89%, GBP/USD short at 87%, USD/JPY short at 82%, and USD/CHF long at 85%.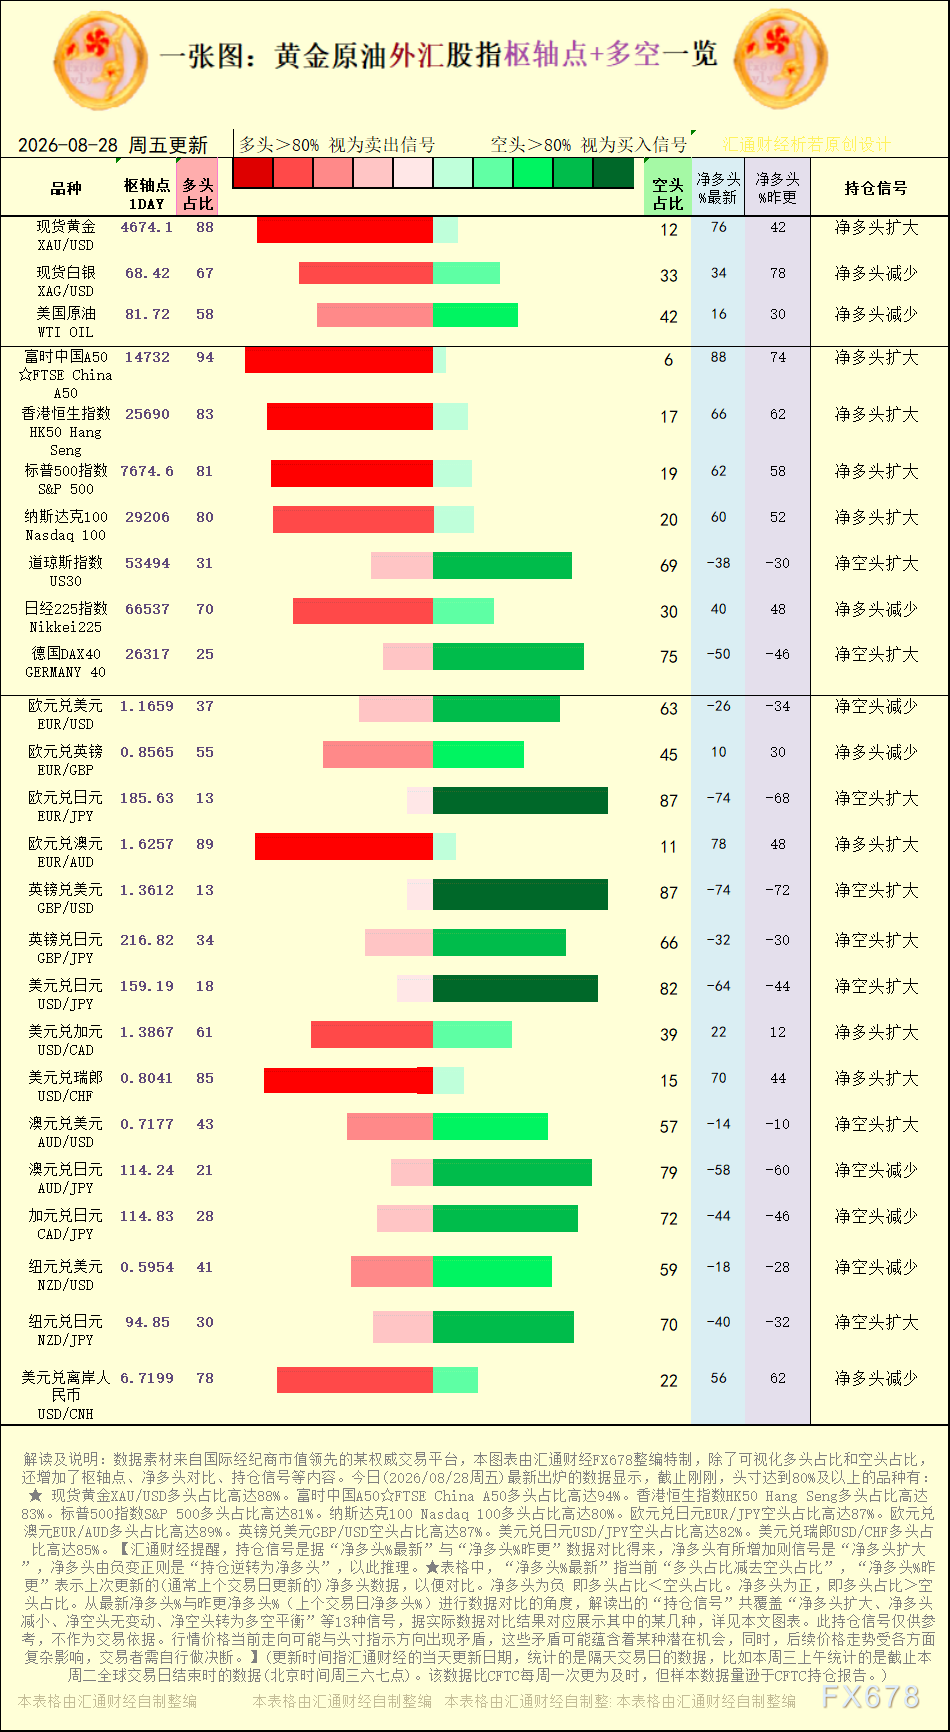
[Chart: Pivot points and long/short position signal interpretation for gold, crude oil, forex, and equity indices. Source: Huitong Finance special chart. (Click image to enlarge)]
Net short reduction observed in: EUR/USD, AUD/JPY, CAD/JPY, NZD/USD.
Net long expansion observed in: spot gold XAU/USD, S&P 500, Nasdaq 100, EUR/AUD, USD/CAD, USD/CHF. Net long reduction observed in: spot silver XAG/USD, WTI OIL, Nikkei225, EUR/GBP, USD/CNH.
Huitong Finance reminds that position signals are derived by comparing the “latest net long %” with the “net long % updated yesterday.” Net long increase signals “net long expansion,” and net long shifting from negative to positive signals “position reversal to net long.” For example, “latest net long %” means the current difference between long and short position ratios; “yesterday net long %” is the previous update (usually the previous trading day's net long data) for comparison. A negative net long means long ratio short ratio. By comparing the latest and previous net long %, a total of 13 types of position signals can be interpreted, such as “net long expansion, net long reduction, no change in net short, net short shifting to neutral,” etc., with several signals displayed in the chart according to the actual data. For details, see the chart in this article.
[The trading instruments covered in this chart include: spot gold, spot silver, WTI crude oil, S&P 500, Nasdaq 100, Dow Jones, Germany DAX40, EUR/USD, EUR/GBP, EUR/JPY, EUR/AUD, GBP/USD, GBP/JPY, USD/JPY, USD/CAD, USD/CHF, AUD/USD, AUD/JPY, CAD/JPY, NZD/USD.]
Disclaimer: The content of this article solely reflects the author's opinion and does not represent the platform in any capacity. This article is not intended to serve as a reference for making investment decisions.
You may also like
Canadian Dollar flatlines as traders await Jackson Hole Symposium
Aptos price eyes bullish reversal as network transactions approach 5 billion
Chainlink targets $15 as Charles Schwab expands crypto platform
$PURR Fully Diluted Market Cap Crosses $3B for the First Time — FDV Hits $3.08B

Crypto prices
More


