invezz.com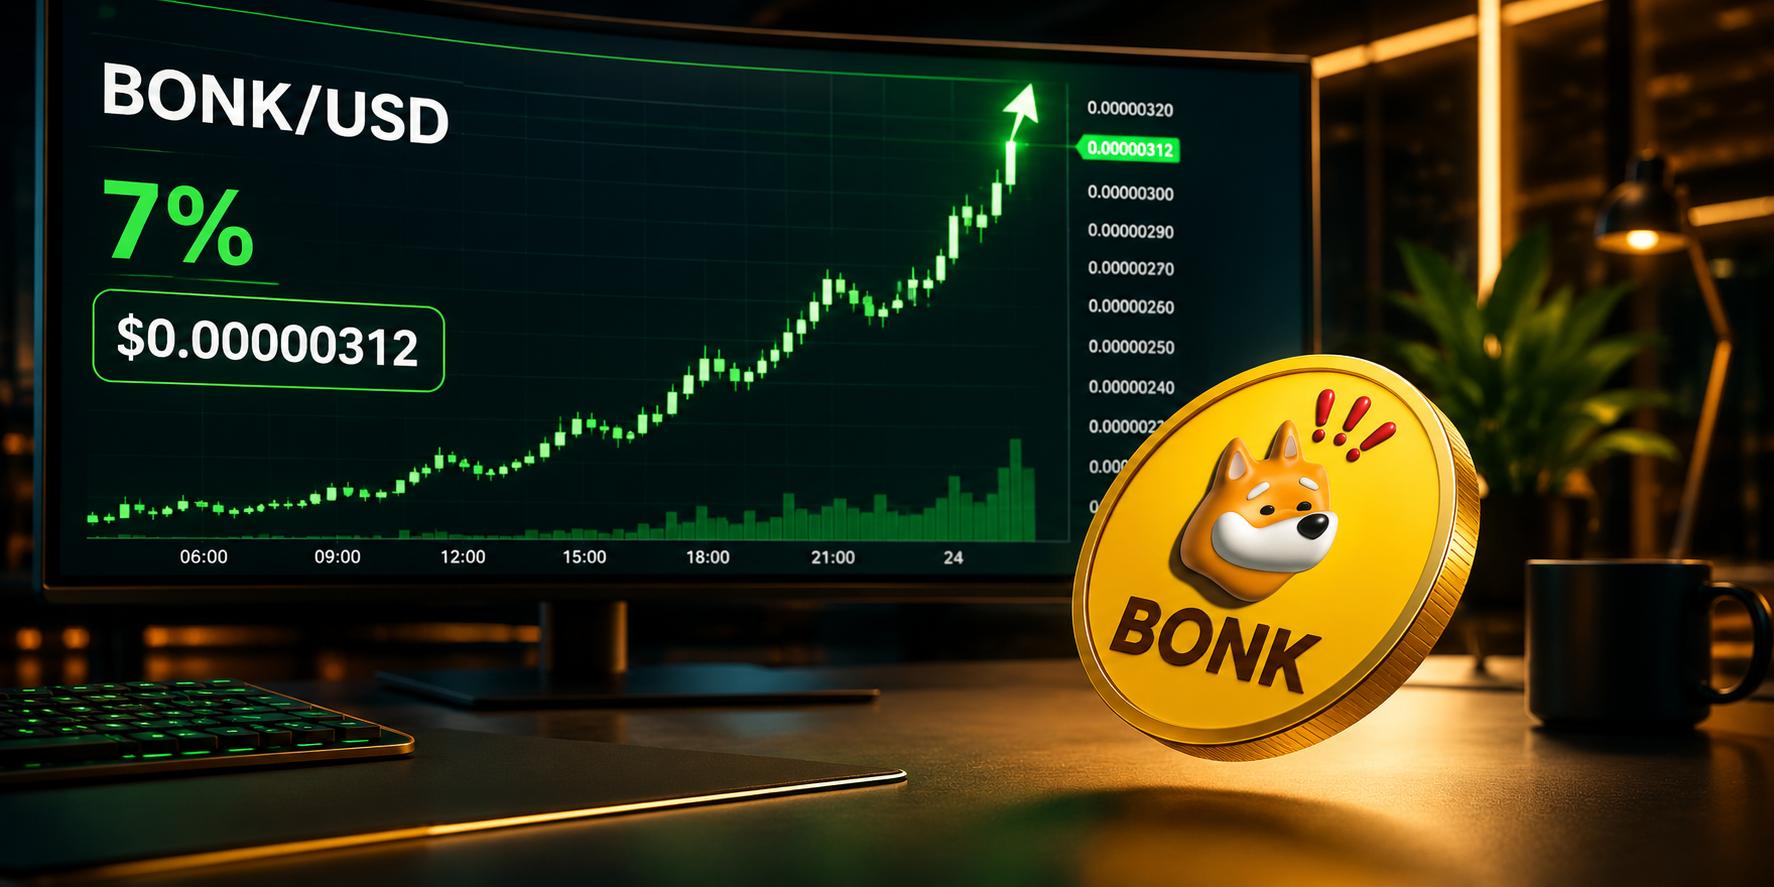
Bonk extended its recovery on Tuesday, rising 7% after posting a similar gain during the previous session.
The two-day advance has allowed the Solana-based memecoin to recover the 14% decline it suffered last week.
Improving conditions across the broader cryptocurrency market have renewed demand for speculative assets, with retail traders increasing their exposure to $BONK.
The technical outlook also favors buyers as the price approaches a potential breakout from a falling-channel pattern.
$BONK futures demand signals fresh capital inflows
$BONK is attracting renewed retail interest as the wider crypto market recovery directs capital back toward memecoins.
Data from CoinGlass shows that $BONK futures open interest increased 20% over the past 24 hours.
The rise indicates that traders are opening new positions and increasing the notional value of active perpetual futures contracts.
$BONK’s open interest-weighted funding rate also remains positive at 0.0069%.
Positive funding means traders holding long positions are paying those with short exposure, suggesting that bullish bets currently dominate the derivatives market.
While rising open interest can strengthen an ongoing rally, it also increases the risk of volatility if heavily leveraged positions begin to unwind.
$BONK price outlook: $BONK tests falling-channel resistance
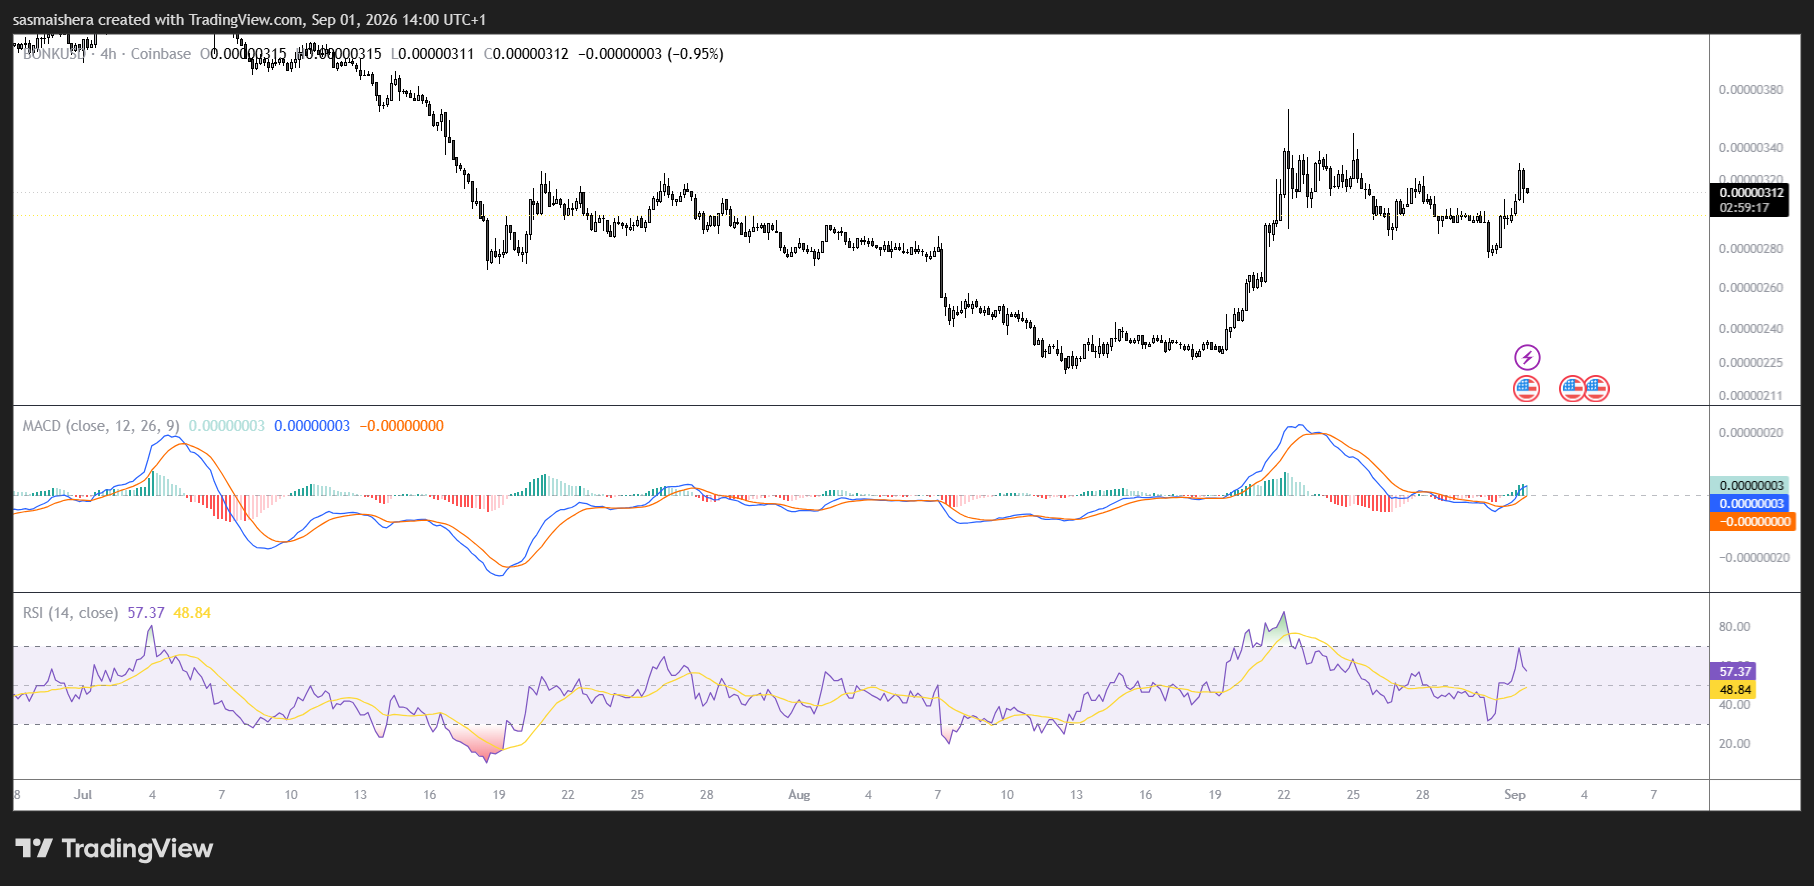
$BONK traded above $0.00000300 on Tuesday as buyers attempted to sustain the two-day recovery.
The token is testing a descending resistance trendline near $0.00000338. This trendline connects the highs recorded on May 10 and August 22 and forms the upper boundary of a falling-channel pattern on the daily chart.
The channel’s lower boundary is positioned near $0.00000185. A confirmed daily close above $0.00000338 would signal a bullish breakout and could encourage additional buying pressure.
If $BONK clears the falling-channel resistance, the next major target would be the 50% Fibonacci retracement level at $0.00000430.
This retracement is calculated from the broader decline between $0.00000831 and $0.00000222.
Reaching $0.00000430 would confirm a stronger recovery and place $BONK above the midpoint of its previous downswing.
However, buyers must first overcome the concentrated selling pressure near $0.00000338. $BONK’s momentum indicators reinforce its improving technical outlook.
The Relative Strength Index has risen to 53 on the 4-hour chart after moving above neutral territory.
The reading indicates growing buying pressure while remaining below the overbought threshold of 70.
Meanwhile, the Moving Average Convergence Divergence indicator and its signal line maintain positive slopes above the zero level.
This setup suggests that bullish momentum is strengthening as $BONK approaches channel resistance.
Despite the bullish momentum, failure to break above $0.00000338 could trigger another rejection from the channel’s upper boundary.
A reversal below $0.00000275 would weaken the recovery and could extend the decline toward the recent swing low at $0.00000222.
$BONK’s near-term direction will therefore depend on whether buyers can convert the current resistance test into a confirmed falling-channel breakout.