
Gold prices turn higher, yen cross-market turmoil drags down the US dollar

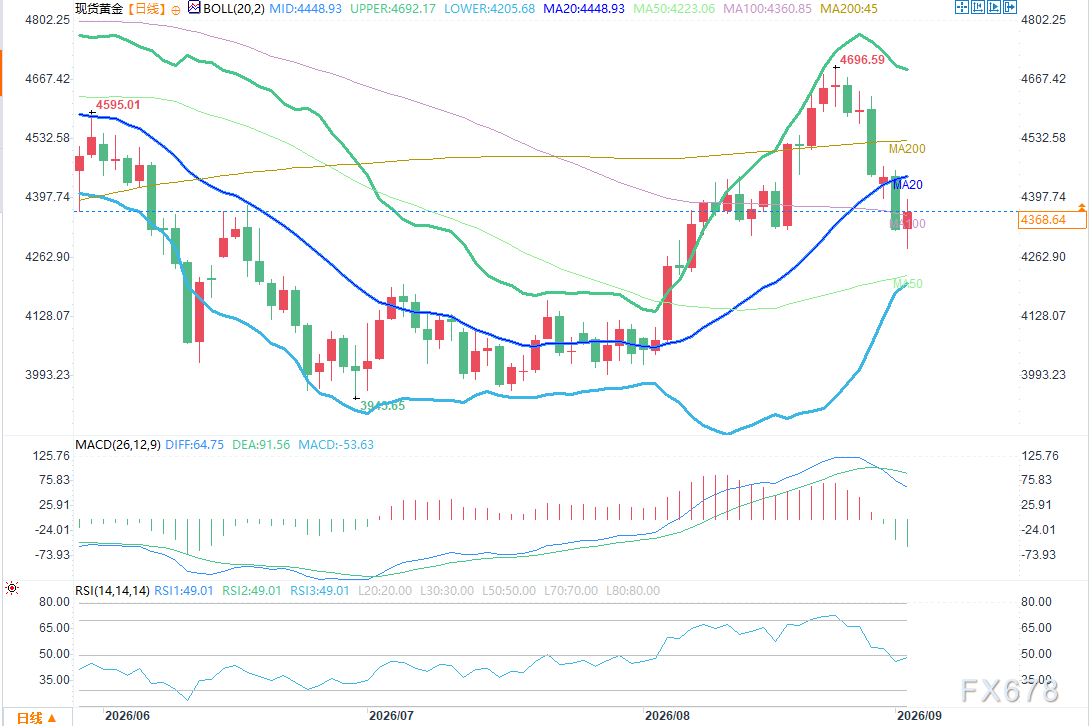
FXStreet, September 3—— Gold prices rebounded on Wednesday, supported by a pullback in US Treasury yields and a weakening US dollar. Tensions in the Middle East have driven up oil prices, complicating the inflation outlook for major central banks. Bears remain in control below the 100-day simple moving average, with the lower Bollinger Band providing the first line of support.
During US trading hours on Wednesday (September 2), spot gold saw a sharp rebound, recouping all previous losses; the Japanese yen suddenly strengthened, triggering broad US dollar selling, coupled with a decline in US Treasury yields, providing a dual boost for this precious metal. At the time of writing, spot gold traded near $4,373, up nearly 1.0% intraday; previously, gold prices had fallen to an intraday low of $4,282, the lowest level since August 7.
USD/JPY plunged sharply during the US session, after the pair had approached the 160 mark, sparking speculation that Japanese authorities might have once again intervened in the forex market. The strengthening yen trend spread across all yen crosses, with EUR/JPY, GBP/JPY, and AUD/JPY all experiencing significant declines. However, there is no official confirmation yet that Japan has intervened in the foreign exchange market.
Weaker-than-expected US labor market data also weighed on the US dollar. The ADP Private Employment Report showed that the US private sector added 38,000 jobs in August, lower than the market expectation of 47,000, and down from the previous value of 46,000.
The US Dollar Index (DXY) is currently trading near 99.55, down from the August 14 high of 99.86, and has dropped 0.12% intraday.
Even with gold prices seeing a short-term recovery, the overall environment for gold remains challenging. After several weeks of relative calm, renewed conflict in the Middle East and rising oil prices have brought back inflation concerns and global bond selloffs. The US 10-year benchmark yield reached 4.81%, its highest level since October 2023, before retreating to around 4.79%. Higher yields increase the opportunity cost of holding non-interest-bearing assets like gold, suppressing gold prices.
John Williams, President of the New York Fed, said on Wednesday, "Yields are moving higher because of strong economic fundamentals and improving economic outlook, not driven by inflation expectations." He also noted that bond yields are somewhat linked to the Middle East conflict.
On the monetary policy front, markets have increased bets that the Federal Reserve will start raising rates as early as September. Last week, Fed Chair Kevin Walsh made hawkish statements on inflation at the Jackson Hole global central bank symposium, reinforcing expectations of a rate hike. The CME FedWatch Tool now shows the probability of a rate hike at the September 15–16 meeting has risen to about 64%, compared to just 36% a week earlier.
Against this backdrop, if US dollar selling continues, gold may see further short-term recovery. However, persistent hawkishness from the Fed, elevated US Treasury yields, and the inflation risk from Middle East conflict will all cap gold’s upside potential. Traders will focus on Friday’s US Nonfarm Payrolls report, as the data could shift expectations for Fed rate policy and drive the next move in the dollar, Treasury yields, and gold.
Spot gold is currently just holding above the 100-day simple moving average near $4,361, providing fragile downside protection, but prices remain below the middle Bollinger Band (around $4,450).
(Spot Gold Daily Chart Source: EkaFX)
The daily Relative Strength Index (RSI) is hovering near the 50 threshold, and the MACD histogram remains negative; both indicators point to fading bullish momentum, with current gold prices oscillating in a broadly neutral range.
To the upside, the first resistance lies at the 20-period Bollinger moving average at $4,450; if bulls regain control of the price action, the next key resistance will be the upper Bollinger Band at $4,685.
On the downside, the 100-day MA at $4,361 offers immediate support, followed by the lower Bollinger Band at $4,215. If selling intensifies and gold prices fall sharply, the next key psychological support will be at the $4,000 level.
Disclaimer: The content of this article solely reflects the author's opinion and does not represent the platform in any capacity. This article is not intended to serve as a reference for making investment decisions.
You may also like
Corporate Crypto Buying Is Sending a Signal: 5 Altcoins Worth Risking Before the Next Big Rally

Gold rebounds above $4,350 as US Dollar, Treasury yields slip
Crypto’s Biggest Regulatory Gamble Is Here: 5 Altcoins That Could Explode If the CLARITY Act Passes

AI Server and Network Demand Surges Amid Supply Chain Challenges; HPE.US Q3 Earnings Exceed Expectations but Face After-Hours Shock
After the close of trading on Wednesday Eastern Time, Hewlett Packard Enterprise announced its financial results for the third quarter ending July 31.

Crypto prices
More


