
Paramount Skydance stock holds bullish trend, stalls at $10.95 resistance

Paramount Skydance stock trades near $10.80 at a technical crossroads. The daily chart still favors bulls, with price above both the 20-day and 50-day EMAs. However, shorter timeframe momentum is softening—a divergence worth unpacking before drawing conclusions about where PSKY heads next.
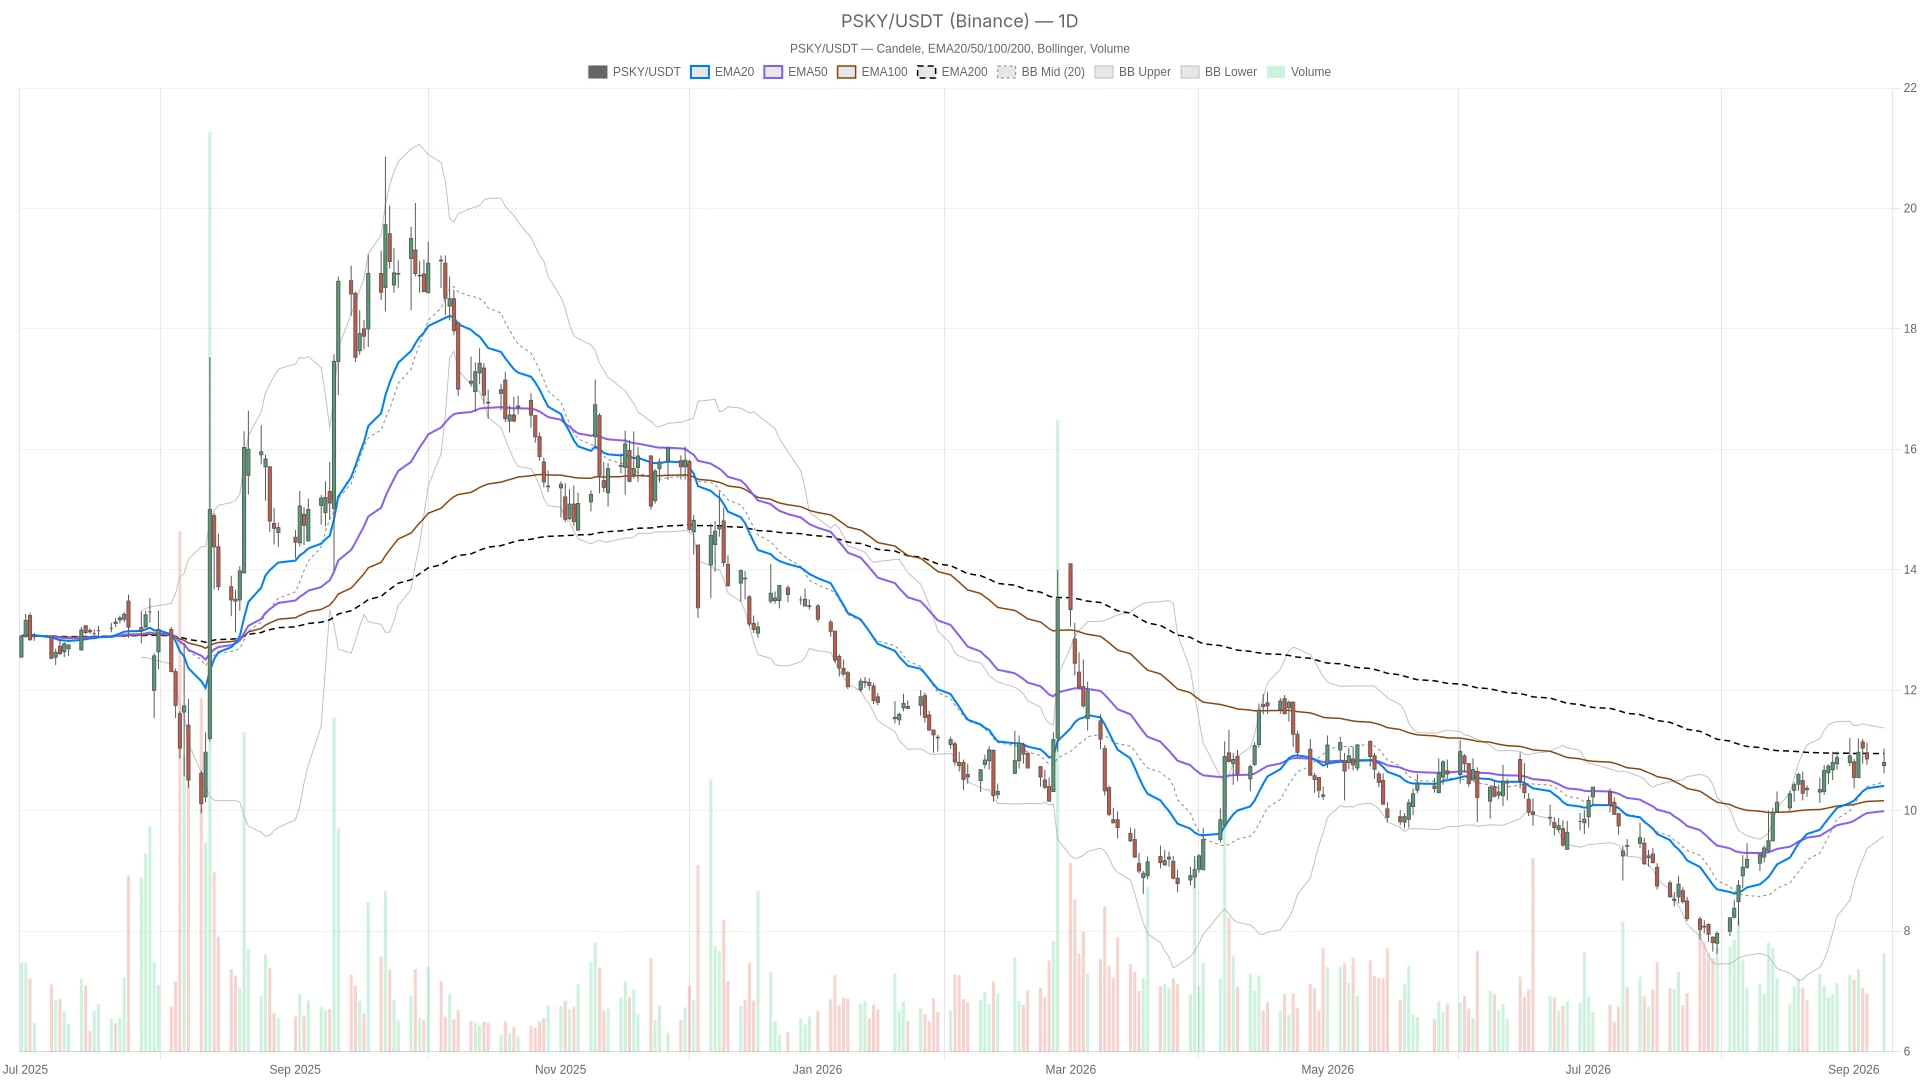 PSKY — daily chart with candlesticks, EMA20/EMA50 and volume.
Summary
Key takeaways
- PSKY closed at $10.80, with the session ranging between $10.62 and $11.03.
- Daily RSI14 at 62.79 remains below overbought territory, leaving room for further upside.
- The 200-day EMA at $10.95 is acting as resistance, capping recent rally attempts.
- Hourly RSI has cooled to 47.16, contrasting with the daily chart’s bullish reading.
- The $10.76–$10.82 zone is the critical short-term cluster to watch for directional cues.
Daily Structure: Bullish Tilt, But EMA200 Is a Wall
PSKY’s daily chart confirms an intact intermediate uptrend, with price comfortably above both short-term EMAs. However, the 200-day EMA at $10.95 is actively capping further upside near current levels.
On the daily chart, PSKY closed at $10.80 after a session that ranged between $10.62 and $11.03. Price remains comfortably above the 20-day EMA at $10.41 and the 50-day EMA at $9.99. Notably, the 200-day EMA sits just above spot at $10.95, acting as a lid on further upside. That level, together with the daily pivot at $10.82, explains why price has struggled to push decisively higher in recent sessions.
Momentum Indicators: Room to Run, but Impulse Fading
Daily RSI14 reads 62.79—a healthy bullish reading, not yet stretched into overbought territory above 70. There is still room for the rally to extend before momentum becomes a concern. Meanwhile, the MACD tells a more cautious story. The line and signal overlap at 0.42, with the histogram flattening to zero. This suggests the bullish impulse that drove the recent advance is losing steam, even if it hasn’t reversed.
Bollinger Bands add further context. The mid-band sits at $10.48, with the upper band at $11.37 and the lower band at $9.58. Price is trading above the midline, closer to the upper half of the range. This is consistent with an uptrend that still has breathing room before hitting statistical extremes. The daily ATR14 of $0.42 points to moderate volatility, roughly 4% of current price, which is typical for this name.
Hourly Timeframe: Where the Conflict Shows Up
PSKY’s hourly chart reveals a stalling move beneath short-term resistance. Price is testing support rather than pushing higher, and momentum indicators have turned flat to mildly negative.
On the 1-hour chart, price at $10.81 is trading below its 20-period EMA of $10.87. Still, it remains in line with the 50-period EMA at $10.81 and well above the 200-period EMA at $10.13. In other words, the broader intraday trend is still up, but the immediate short-term structure shows hesitation.
Intraday Momentum Turns Cautious
RSI14 on the hourly chart has cooled to 47.16, a neutral reading that contrasts with the daily’s more bullish 62.79. At the same time, the hourly MACD has flipped slightly negative, with the histogram at -0.01. That is not a dramatic bearish signal, but it does confirm that buyers have paused. The hourly pivot at $10.85 sits above current price, with support at $10.76. PSKY is currently testing that lower zone rather than pushing toward resistance at $10.90.
Therefore, the daily and hourly timeframes are sending slightly different messages. The daily bias remains constructive, supported by EMA alignment and RSI strength. However, the hourly chart shows a stalling move, with price slipping under its own short-term average. Momentum indicators are turning flat to mildly negative. This is a case of a bullish daily setup meeting short-term digestion, not outright rejection.
15-Minute View: Execution Context
The 15-minute chart confirms a consolidating market with no clear directional bias. Price hovers on its 200-period EMA as traders await a catalyst before committing to either side.
On the 15-minute chart, price at $10.81 is hovering almost exactly on its 200-period EMA of $10.81. It sits below both the 20-period and 50-period EMAs at $10.88. RSI14 at 44.41 and a flat MACD histogram both point to a market that is consolidating rather than trending. The 15-minute pivot at $10.84 and support at $10.76 mirror the hourly structure closely. This reinforces that $10.76 is the key short-term level to watch for intraday direction.
Bullish Scenario
For the bullish case to gain traction, PSKY must reclaim the daily pivot at $10.82. It then needs to clear the 200-day EMA resistance at $10.95.
A push through the daily R1 at $11.01 would add further confirmation. Ideally, this move would come with RSI staying above 60 without becoming overbought. The daily MACD histogram would also need to turn positive again rather than flattening. On the fundamental side, continued progress on the Warner Bros. Discovery deal could serve as a positive catalyst. CEO David Ellison has already cleared regulatory approval in 68 jurisdictions. The remaining legal hurdle, if resolved favorably, would likely support upside momentum.
Bearish Scenario
The bullish thesis weakens meaningfully if PSKY fails to hold above the daily 50-EMA at $9.99. A break below daily S1 at $10.60 would add further pressure.
A breakdown on the hourly chart through the $10.76 support would signal that short-term selling pressure is spreading. Confirmation on the 15-minute timeframe would reinforce the bearish case. A flip of the daily MACD into negative histogram territory would further undercut bullish arguments. In contrast to deal-related optimism, the lawsuit from 12 state attorneys general remains an unresolved overhang. Any negative headline on that front could trigger renewed downside volatility.
Closing Take on Paramount Skydance Stock
Overall, Paramount Skydance stock sits in a genuinely two-sided setup right now. The daily trend structure still leans bullish, but the hourly and 15-minute charts show a market pausing to digest recent gains. Resistance near the 200-day EMA remains a well-defined ceiling. Volatility, measured by the daily ATR of $0.42, remains moderate rather than extreme, fitting a stock consolidating ahead of a binary catalyst.
With the Warner Bros. Discovery deal still pending final legal clearance, uncertainty around PSKY is likely to stay elevated. Traders should watch the $10.76–$10.82 zone closely. A decisive break in either direction from this cluster of pivots and averages will likely dictate the next leg for the stock.
FAQ
What is the key resistance level for Paramount Skydance stock?
The 200-day EMA at $10.95 is the primary resistance capping PSKY’s upside. The daily pivot at $10.82 and R1 at $11.01 also serve as near-term hurdles that need to be cleared for the rally to extend.
Is PSKY’s uptrend still intact?
Yes. PSKY remains above both the 20-day EMA at $10.41 and the 50-day EMA at $9.99 on the daily chart. Daily RSI14 at 62.79 further supports the bullish structure, though short-term momentum has cooled noticeably on the hourly chart.
What is the most important short-term level to watch?
The $10.76–$10.82 zone is the critical cluster. It contains the hourly support at $10.76 and the daily pivot at $10.82. A decisive break in either direction from this zone will likely determine the stock’s next directional move.
What fundamental catalyst could move Paramount Skydance stock?
The pending Warner Bros. Discovery deal is the key catalyst. CEO David Ellison has secured regulatory clearance in 68 jurisdictions, but a lawsuit from 12 state attorneys general remains unresolved. Any development on that front could trigger significant price action.
{"@context":"","@type":"FAQPage","mainEntity":[{"@type":"Question","name":"What is the key resistance level for Paramount Skydance stock?","acceptedAnswer":{"@type":"Answer","text":"The 200-day EMA at $10.95 is the primary resistance capping PSKY's upside. The daily pivot at $10.82 and R1 at $11.01 also serve as near-term hurdles that need to be cleared for the rally to extend."}},{"@type":"Question","name":"Is PSKY's uptrend still intact?","acceptedAnswer":{"@type":"Answer","text":"Yes. PSKY remains above both the 20-day EMA at $10.41 and the 50-day EMA at $9.99 on the daily chart. Daily RSI14 at 62.79 further supports the bullish structure, though short-term momentum has cooled noticeably on the hourly chart."}},{"@type":"Question","name":"What is the most important short-term level to watch?","acceptedAnswer":{"@type":"Answer","text":"The $10.76–$10.82 zone is the critical cluster. It contains the hourly support at $10.76 and the daily pivot at $10.82. A decisive break in either direction from this zone will likely determine the stock's next directional move."}},{"@type":"Question","name":"What fundamental catalyst could move Paramount Skydance stock?","acceptedAnswer":{"@type":"Answer","text":"The pending Warner Bros. Discovery deal is the key catalyst. CEO David Ellison has secured regulatory clearance in 68 jurisdictions, but a lawsuit from 12 state attorneys general remains unresolved. Any development on that front could trigger significant price action."}}]}
Article produced with the assistance of artificial intelligence and reviewed by the editorial team.
Disclaimer: The content of this article solely reflects the author's opinion and does not represent the platform in any capacity. This article is not intended to serve as a reference for making investment decisions.
You may also like
Battery weight reduced by 40% and freed from germanium constraints! Rocket Lab (RKLB.US) lightweight battery taps into the incremental market for space AI
"While IMM Apex delivers exceptional performance, it has also addressed real-world challenges such as rising material costs and supply chain constraints," said Rocket Lab USA President Brad Clevenger.

US Stock Market Preview: All Three Major Index Futures Fall, Brent Oil Surges Past $100, Besant to Announce US Treasury Repo Scale, Apple Event Incoming
On Wednesday, September 9th, before the U.S. stock market opened, futures for the three major U.S. stock indexes all declined.

The ultimate bottleneck for AI is not just electricity, but also the electricity bill! As data centers become a focus in the US elections, AI infrastructure investment faces a "ballot stress test"
In 2026, data center spending, as the backbone of the artificial intelligence industry, will reach a record high. However, alongside the boom in infrastructure construction, opposition to data centers has risen sharply this year. What started as a localized issue has quickly evolved into a key topic for the November midterm elections.

Eurozone Bond Yields Rise as Brent Touches $100; 10-Year Bund Yield Hits 15-Year High -- Update
Crypto prices
More


