
A Chart Overview of Commodity Support and Resistance: Gold, Silver, Oil, Gas, Platinum, Palladium, Copper, and Agricultural Futures (September 10, 2026)

Huitong Net, September 10 — A chart showing commodity support and resistance: gold, silver, oil, gas + platinum, palladium, copper + agricultural futures, updated at 10:00 AM (UTC+8) on Thursday, September 10, 2026. Specifically covers 14 products including gold, silver, platinum, palladium, copper + crude oil, natural gas, fuel oil + wheat, corn, cotton. For more details, please refer to the special chart prepared by Huitong Finance Xiruote.
A chart showing commodity support and resistance: gold, silver, oil, gas + platinum, palladium, copper + agricultural futures, updated at 10:00 AM (UTC+8) on Thursday, September 10, 2026. Specifically covers 14 products including gold, silver, platinum, palladium, copper + crude oil, natural gas, fuel oil + wheat, corn, cotton. For more details, please refer to the special chart prepared by Huitong Finance Xiruote.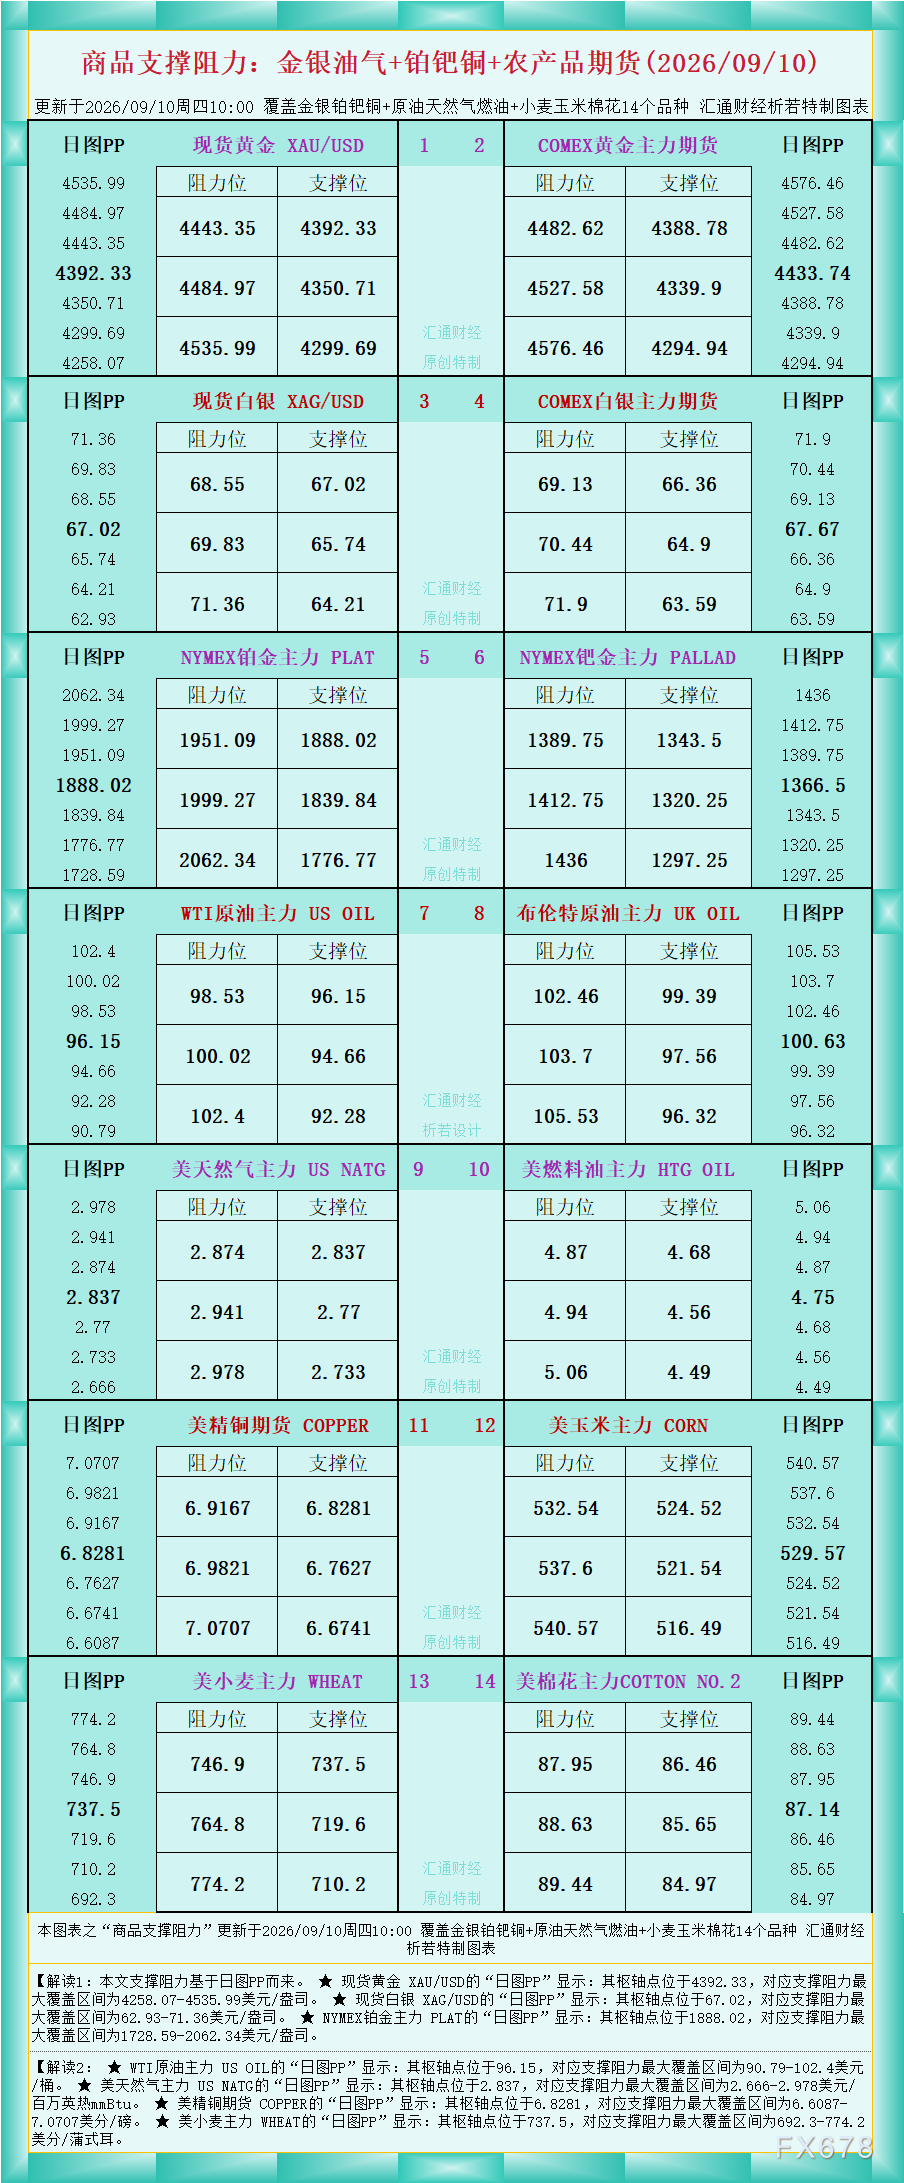
According to the chart data, Interpretation 1: The support and resistance in this article are based on the daily PP chart.
★ For spot gold (XAU/USD), the "daily PP" shows: the pivot point is at 4392.33, with the maximum support and resistance range of 4258.07–4535.99 USD/oz.
★ For spot silver (XAG/USD), the "daily PP" shows: the pivot point is at 67.02, with the maximum support and resistance range of 62.93–71.36 USD/oz.
★ For NYMEX platinum main contract (PLAT), the "daily PP" shows: the pivot point is at 1888.02, with the maximum support and resistance range of 1728.59–2062.34 USD/oz.
Interpretation 2:
★ For WTI crude oil main contract (US OIL), the "daily PP" shows: the pivot point is at 96.15, with the maximum support and resistance range of 90.79–102.4 USD/barrel.
★ For US natural gas main contract (US NATG), the "daily PP" shows: the pivot point is at 2.837, with the maximum support and resistance range of 2.666–2.978 USD/million BTU.
★ For US copper futures (COPPER), the "daily PP" shows: the pivot point is at 6.8281, with the maximum support and resistance range of 6.6087–7.0707 cents/lb.
★ For US wheat main contract (WHEAT), the "daily PP" shows: the pivot point is at 737.5, with the maximum support and resistance range of 692.3–774.2 cents/bushel.
See the chart for more detailed interpretations of other products.
Disclaimer: The content of this article solely reflects the author's opinion and does not represent the platform in any capacity. This article is not intended to serve as a reference for making investment decisions.
You may also like
Itama Ranoraya says unaware of any material information behind share trading volatility
Solusi Sinergi Digital releases transcript of 2026 annual public expose
Pool Advista Finance says unaware of material information behind share-trade volatility
Crypto prices
More


