
Filecoin Crypto’s RSI Hits 84 as Timeframes Send Mixed Signals

As of September 13, 2026, FIL traded at $0.99 after a sharp rally that left every major moving average far behind. This Filecoin crypto technical picture forces a key question: is the trend extending, or is the asset stretched too far, too quickly?
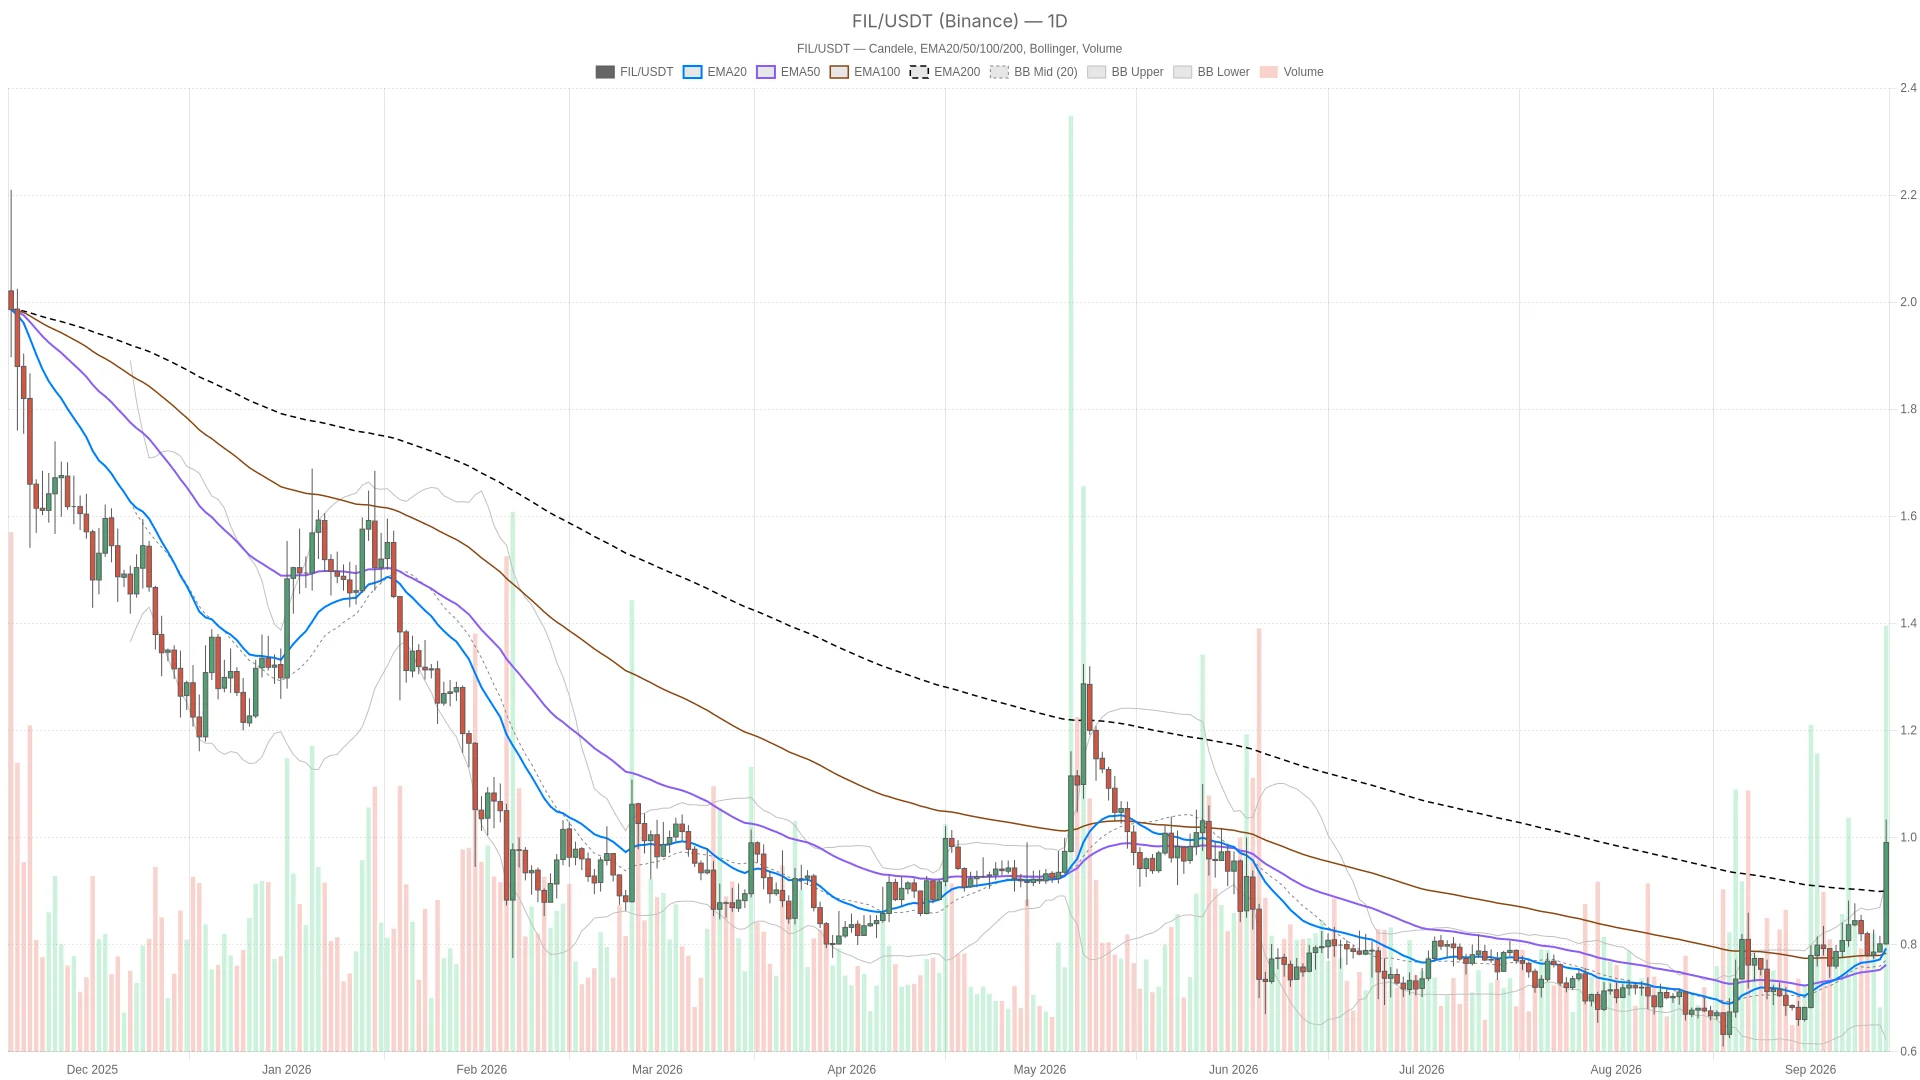 FIL/USDT — daily chart with candlesticks, EMA20/EMA50 and volume.
Summary
Key takeaways
- FIL closed at $0.99, trading above its EMA20 ($0.79), EMA50 ($0.76), and EMA200 ($0.90) on the daily chart.
- Daily RSI14 reached 73.04 and hourly RSI14 hit 84.64, both signaling overbought conditions.
- The 15-minute MACD has turned bearish with a histogram of -0.01, hinting at fading short-term momentum.
- Broader crypto market cap dropped 3.44% in 24 hours while the Fear & Greed Index stands at 61 (Greed).
- Key decision levels: daily pivot at $0.94 and resistance at $1.08.
The broader backdrop adds tension to this setup. Total crypto market capitalization sits near $2.63 trillion with Bitcoin dominance at roughly 58.83%. The Fear & Greed Index reads 61, placing sentiment in Greed territory even as the broader market pulled back. FIL’s strength against a softening macro tape is precisely the divergence traders must resolve before committing to a directional bias.
Daily Chart: Overbought Conditions Take Hold
On the daily timeframe, FIL closed at $0.99 against an EMA20 of $0.79, an EMA50 of $0.76, and an EMA200 of $0.90. Price trading above all three averages confirms the trend has been unambiguously up. However, the gap itself is a warning. When price runs this far ahead of its EMA20, mean reversion becomes a genuine possibility even within an intact uptrend.
The daily RSI14 sits at 73.04, comfortably in overbought territory. That does not automatically signal an imminent reversal, but it does suggest the easiest long entries have already occurred. MACD remains constructive: the line at 0.04 stands above the signal at 0.02, with a positive histogram of 0.02. Momentum has not rolled over yet, though it is decelerating at the edges.
Bollinger Bands reinforce the overbought reading. The daily mid-band sits at $0.77, with the upper band at $0.92 and the lower at $0.62. FIL’s $0.99 close above the upper band entirely signals an extended, possibly exhausted push. Daily ATR14 of 0.07 confirms volatility expanded alongside the move. Pivot levels place resistance at $1.08 (R1) and support at $0.85 (S1), with the pivot point at $0.94.
Hourly and 15-Minute Timeframes: Diverging Signals
The 1H chart intensifies the overbought picture. Hourly RSI14 stands at 84.64, an extreme reading that typically precedes at least a short consolidation. EMAs remain bullishly stacked: the 20 at $0.89, the 50 at $0.85, and the 200 at $0.81 all sit beneath price. MACD stays positive, with the line at 0.05 versus a signal of 0.03. The hourly regime is officially bullish, but it is running very hot.
The 15-minute chart tells a more nuanced story. RSI14 has cooled to 63.05, still bullish but far from the extremes seen on the hourly. More significantly, the 15m MACD has flipped negative: the line at 0.02 sits below the signal at 0.03, producing a histogram of -0.01. This short-term bearish crossover appears inside a daily and hourly structure that remains technically bullish. That tension is worth flagging explicitly.
Bollinger Bands on the 15m are tight, with the mid-band at $0.98, upper at $1.02, and lower at $0.95. This compression is consistent with a market pausing to decide its next move rather than committing to fresh direction. The 15m pivot sits at $0.99, with resistance at $1.00. Price is effectively testing the boundary between consolidation and a breakout attempt.
Bullish Scenario: Trend Extension Despite Overbought Readings
The bullish case rests on the daily and hourly EMA structure holding firm. If FIL clears the daily pivot resistance at $1.08 with volume, that would confirm the uptrend still has momentum despite overbought readings. Strong trends can stay overbought for extended periods before mean-reverting. A successful cooldown — hourly RSI easing from 84 without breaking EMA20 support near $0.89 — would also support continuation. This scenario fails if price loses the daily EMA20 at $0.79.
Bearish Scenario: Overbought Unwind Gains Traction
The bearish case leans on the daily RSI at 73.04 and hourly RSI at 84.64 finally resolving through a pullback. The 15m MACD bearish cross provides an early warning. A break below the daily pivot at $0.94, followed by a test of S1 support at $0.85, would confirm the unwind is underway. This becomes more likely if broader market softness continues. The scenario is invalidated if FIL reclaims and holds above the $0.99 zone.
Positioning and Risk: A Two-Sided Setup
Right now, Filecoin crypto presents a genuinely two-sided setup. The daily and hourly trends read bullish by the numbers, but both are overbought enough that a mean-reversion move would not be surprising. The 15-minute MACD is already hinting that short-term momentum is fading first. Daily ATR14 at 0.07 versus hourly ATR14 at 0.03 confirms elevated volatility across timeframes. Moves in either direction could be sharp rather than gradual.
Layered on top is a broader market where total capitalization slipped 3.44% in a day while the Fear & Greed Index reads 61. That produces a market that is sentimentally optimistic but technically fragile. Traders should treat the daily pivot at $0.94 and the $1.08 resistance as the real decision points. Size accordingly for the volatility ATR readings imply and expect overbought conditions across multiple timeframes to resolve with more volatility, not less.
FAQ
Is Filecoin overbought right now?
Yes. The daily RSI14 reads 73.04 and the hourly RSI14 stands at 84.64, both firmly in overbought territory. Additionally, FIL closed at $0.99, above the daily Bollinger upper band of $0.92, which reinforces the extended nature of the current move.
What are the key support and resistance levels for FIL?
On the daily timeframe, the pivot point sits at $0.94 with support at $0.85 (S1) and resistance at $1.08 (R1). The daily EMA20 at $0.79 serves as a deeper support level. On the 15-minute chart, the pivot is at $0.99 with immediate resistance at $1.00.
Does the 15-minute MACD bearish crossover mean a reversal is coming?
Not necessarily. The 15m MACD has turned negative with a histogram of -0.01, but the daily and hourly MACD readings remain positive. This suggests short-term momentum is fading while the higher timeframe trend remains intact. The crossover serves as a warning rather than a confirmed reversal signal.
{"@type":"FAQPage","mainEntity":[{"@type":"Question","name":"Is Filecoin overbought right now?","acceptedAnswer":{"@type":"Answer","text":"Yes. The daily RSI14 reads 73.04 and the hourly RSI14 stands at 84.64, both firmly in overbought territory . Additionally, FIL closed at $0.99, above the daily Bollinger upper band of $0.92, which reinforces the extended nature of the current move."}},{"@type":"Question","name":"What are the key support and resistance levels for FIL?","acceptedAnswer":{"@type":"Answer","text":"On the daily timeframe, the pivot point sits at $0.94 with support at $0.85 (S1) and resistance at $1.08 (R1). The daily EMA20 at $0.79 serves as a deeper support level. On the 15-minute chart, the pivot is at $0.99 with immediate resistance at $1.00."}},{"@type":"Question","name":"Does the 15-minute MACD bearish crossover mean a reversal is coming?","acceptedAnswer":{"@type":"Answer","text":"Not necessarily. The 15m MACD has turned negative with a histogram of -0.01, but the daily and hourly MACD readings remain positive. This suggests short-term momentum is fading while the higher timeframe trend remains intact. The crossover serves as a warning rather than a confirmed reversal signal."}}]}
Article produced with the assistance of artificial intelligence and reviewed by the editorial team.
Disclaimer: The content of this article solely reflects the author's opinion and does not represent the platform in any capacity. This article is not intended to serve as a reference for making investment decisions.
You may also like
Sui trades near $0.72 as TD Sequential flashes buy signal, support zone in focus

On the eve of the 5% threshold, the U.S. Treasury sell-off presents a tough challenge for the market and the Federal Reserve
A sell-off in the bond market has pushed a key U.S. Treasury yield close to 5%, heightening concerns from Wall Street to Washington about the impact of rising borrowing costs on the U.S. economy.

McDonald’s Corporation stock hits 52-week low as dividend yield hits 6-year high
Crypto prices
More


