

- SUI Recovery begins with a weekly close above $1.00-$1.10 before the broader resistance roadmap becomes technically active.
- Sellers pushed SUI below $1.00 as buyers defended $0.95 support during elevated trading volume and renewed market volatility.
- CoinGlass liquidation data shows leveraged traders remain active around $0.90-$1.00 as longs and shorts alternate through sharp market swings.
SUI Recovery remains focused on critical weekly technical levels after recent selling pressure across markets. Traders await confirmation before broader recovery attempts regain momentum through nearby resistance zones again.
Weekly Reclaim Sets the First Recovery Test
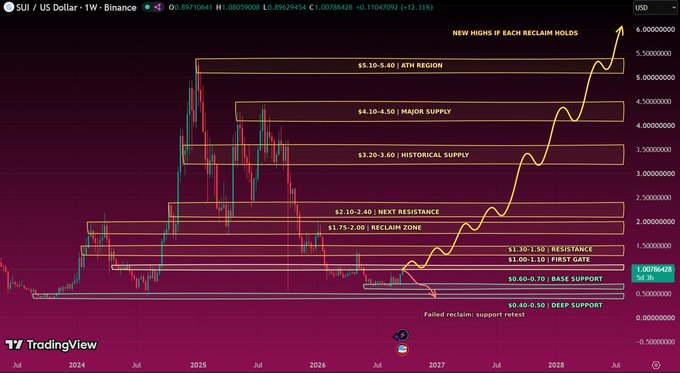
The weekly chart presents recovery as a sequence instead of one immediate breakout attempt. Each resistance level requires confirmation before another target becomes technically relevant for traders. Former resistance must become reliable support before bullish continuation receives additional confirmation signals.
The first recovery objective sits between $1.30 and $1.50 after initial confirmation arrives. This range previously rejected price during earlier recovery attempts across the weekly structure. Clearing that zone opens attention toward the $1.75-$2.00 trading region next.
The roadmap becomes progressively more difficult beyond the early recovery zones on weekly charts. Resistance strengthens between $2.10 and $2.40 before historical supply appears higher overhead. Every projected advance depends on successful weekly closes and confirmed support retests afterward.
Intraday Selling Keeps Focus on Near-Term Support
Sellers have been driving momentum for the most recent trading sessions on the 24-hour chart on CoinMarketCap. Price has been drifting lower since it was trading above $1.02 in early market trading. Lower highs developed before downside momentum accelerated beneath important psychological support levels.
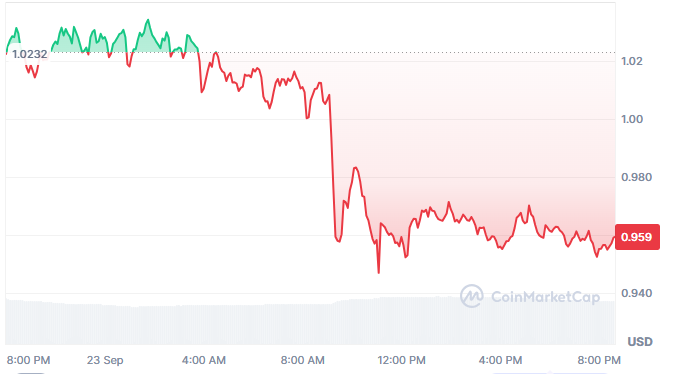
SUI as of writing traded at around $0.9608 after falling below the $1.00 threshold during heavy selling. The decline quickly reached the $0.95 area before buyers attempted a recovery bounce. However, the rebound stalled before reclaiming previous support levels during afternoon trading.
Price later entered a consolidation range between approximately $0.955 and $0.97 throughout afternoon trading. Buyers defended nearby support while sellers continued rejecting advances toward higher resistance levels. The narrow range reflected cooling volatility after the session’s sharp breakdown earlier.
Trading volume increased despite the daily decline across the broader SUI market session. Higher participation accompanied selling pressure instead of quiet market conditions throughout the session. Active positioning continued around nearby support and resistance levels during consolidation trading.
Liquidations Show Intense Leverage Around Key Levels
CoinGlass liquidation data shows leveraged traders repeatedly switching between long and short positions. Large liquidation clusters accompanied several major price reversals during recent months across SUI. The pattern reflects heightened speculative activity during periods of elevated market volatility.
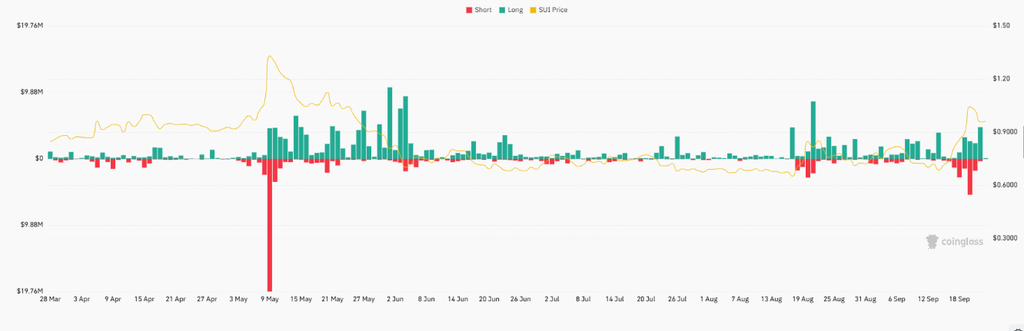
The biggest liquidation event occurred during early May across the analyzed trading period. Long liquidations approached $20 million after SUI reversed sharply from higher levels. That cascade followed aggressive downside momentum and forced leveraged bullish positions from markets.
June produced several notable short liquidation spikes during recovery attempts across the futures market. Short squeezes accelerated rebounds as bearish positions closed during upward price movement quickly. Liquidation activity gradually eased through July before volatility returned during August.
Recent liquidation clusters appeared again around the $0.90-$1.00 trading range during September sessions. Both long and short liquidations increased as price fluctuated around critical support levels. The data shows leveraged positioning remaining concentrated around nearby technical levels before confirmation returns.


