Recent spot exchange-traded fund (ETF) flows point to continued demand, while Solana has reported record levels of stablecoin supply and real-world assets (RWAs).
Those developments offer support for the bullish case, though $SOL still needs to clear nearby resistance to extend its rise.
Spot $SOL ETFs record second-highest weekly inflow
Spot $SOL ETFs drew a combined $188.22 million last week, according to SoSoValue. That was their second-highest weekly inflow since launch and extended their run of positive flows to 13 consecutive weeks, dating back to early June.
The streak suggests investors have continued to add exposure through regulated investment products even as $SOL’s price has moved higher.
It also gives traders another measure of demand to watch during the current pullback: sustained inflows could help absorb selling, while a slowdown might make it harder for $SOL to push through resistance.
ETF flows are only one part of the picture. They show how much money entered the funds during a given period, but they do not guarantee an immediate or lasting rise in $SOL’s price.
This week’s figures will matter more if they confirm that demand remained firm after the token’s recent advance.
Solana also reported fresh milestones in two areas closely watched for signs of network use. In a Monday post, the network said stablecoin supply had reached an all-time high of $17.3 billion.
Stablecoins provide dollar-denominated liquidity for transfers, trading and other applications.
A larger supply can give users more funds to deploy across the network, although the figure alone does not show how actively those tokens are being used.
Solana said its RWA ecosystem had also reached a record of more than $4.6 billion across over 3,000 available assets. The network added that the number of holders of tokenized equities had passed 1 million.
Together, the figures suggest Solana is gaining ground as a venue for assets represented onchain.
Investors will be watching whether that growth continues and translates into sustained activity.
For $SOL, the milestones strengthen the broader demand narrative, but they do not remove the possibility of short-term price swings after a sharp rally.
$SOL tests resistance near $124
On the daily chart, $SOL remains above its 50-day exponential moving average (EMA) at $101.81, as well as its 100-day and 200-day EMAs at $93.94 and $94.65.
Trading above those averages keeps the near-term technical picture constructive despite Monday’s decline.
The relative strength index stood near 63, indicating positive momentum without reaching a typically overbought reading.
A positive moving average convergence divergence histogram also points to continued upward momentum, though both indicators could weaken if the pullback deepens.
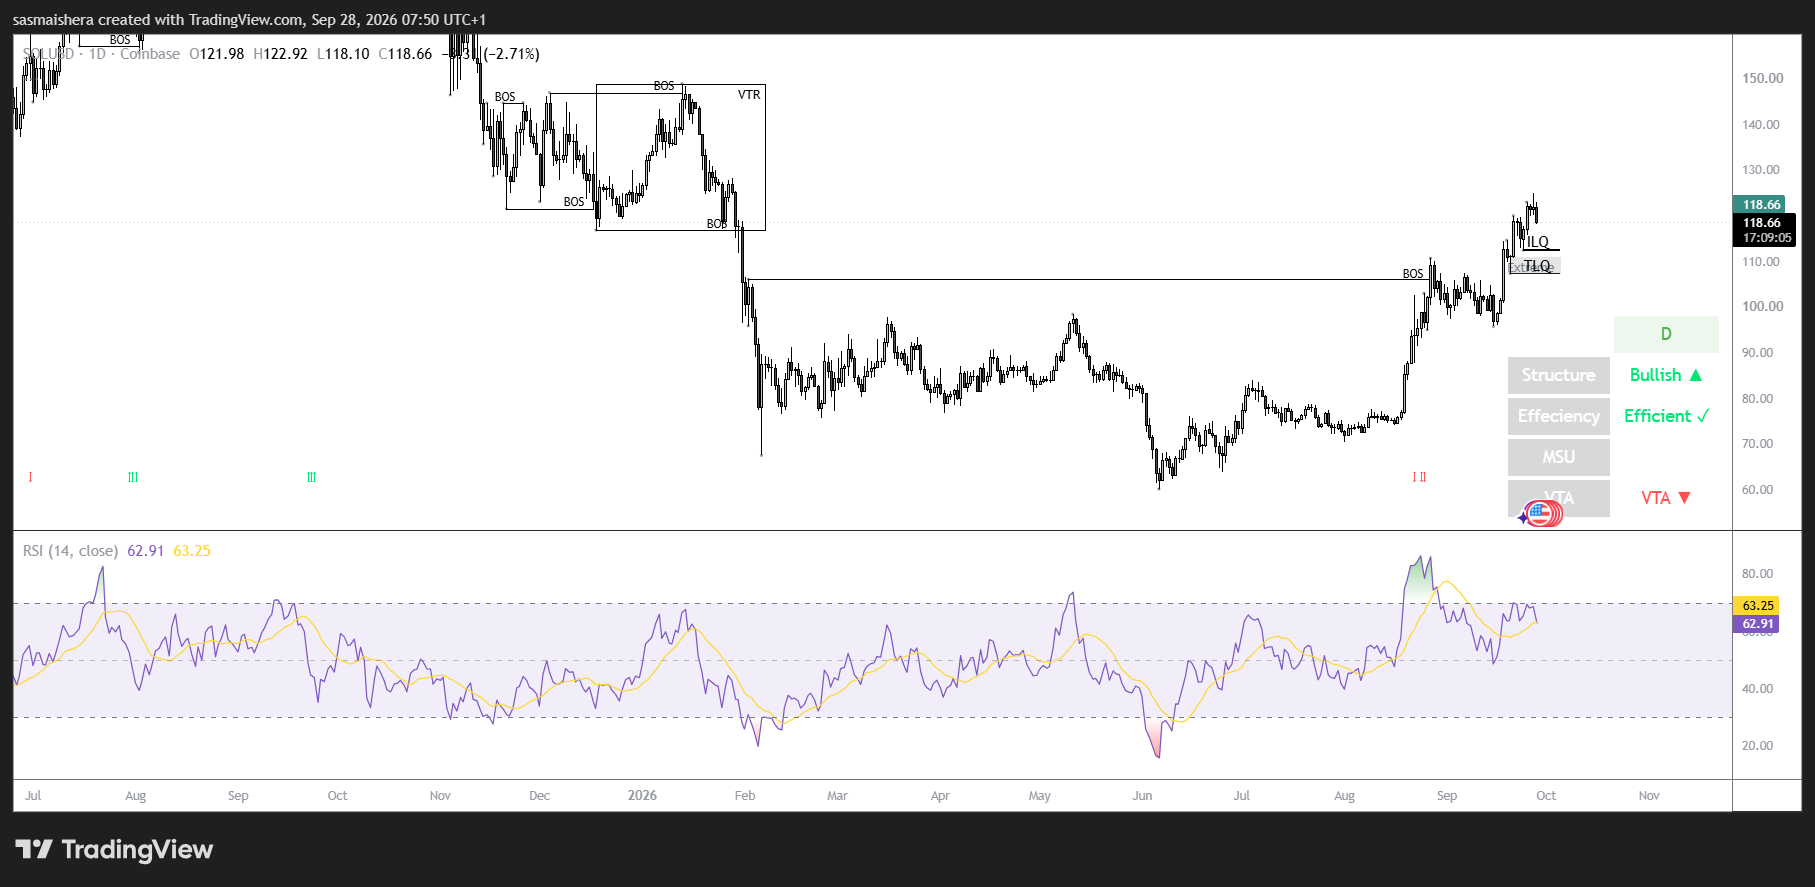
The first upside level to watch is $123.96. A daily close above that resistance would give buyers a clearer sign that $SOL’s advance can resume.
If the pullback continues, the 50-day EMA near $101.81 is the next support. Below it, traders may look to $96.19, and the cluster of longer-term moving averages around $93 to $95. Deeper support lies near $81.96 and $77.07.
For now, $SOL’s decline looks modest beside its recent gains. The next test is whether ETF demand holds up while the token challenges the $123.96 barrier.


 invezz.com