- SHIB trades within converging trendlines, with rising support and descending resistance defining its current daily price structure.
- RSI is at 43.90 and negative MACD bars signal diminishing momentum as SHIB has been consolidating at higher levels.
- A reported seven-day high of $0.000006019 puts the $0.000006 threshold back in focus, but sustained strength remains unconfirmed.
SHIB is in a pivotal technical crossroads with its contracting triangle approaching less support, and traders are waiting to see if buyers are able to sustain the support trend that has risen.
SHIB Price Action Tightens Between Two Trendlines
Shiba Inu’s daily chart shows price moving inside a symmetrical triangle. Descending resistance links lower highs, while rising support connects progressively higher lows. The narrowing space reflects a market still searching for direction.
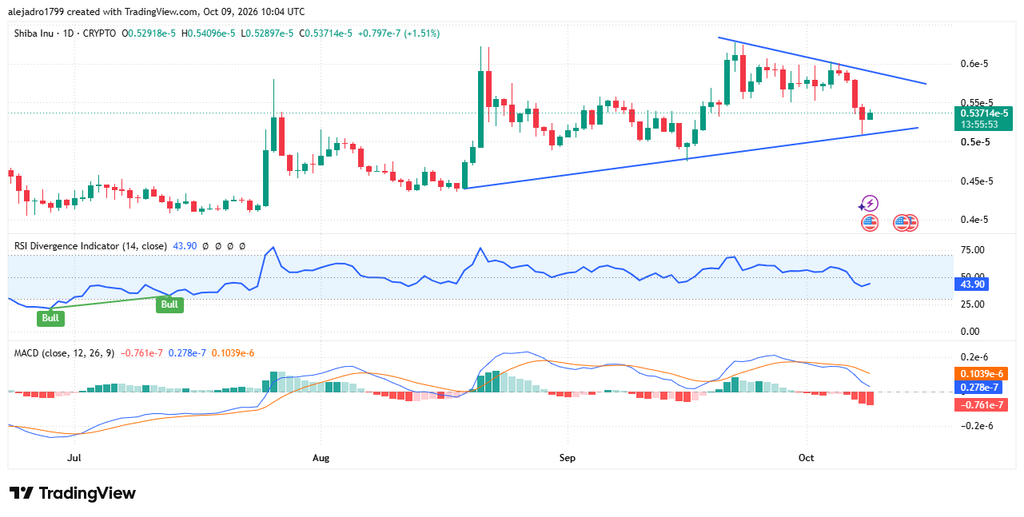
The upper trendline has restricted advances since the September highs. Meanwhile, buyers have repeatedly entered near the rising lower boundary. Neither side has forced a confirmed break from this formation.
The latest candles show a sharp retreat followed by a small recovery. TradingView records the displayed candle closing near $0.0000053714. Price remains below $0.000006, despite recently testing that threshold.
That leaves rising support as an important technical reference. If buyers defend the boundary, another attempt toward resistance remains possible. A daily close below it would weaken the pattern and change the immediate outlook.
RSI and MACD Reveal Softer Market Momentum
The RSI Divergence indicator is showing 43.90 on the daily time frame. The position below 50 indicates that the momentum has been weaker after the pullback. Bullish divergence signals in July did not confirm another recovery.
The MACD offers further evidence of pressure on price. Its displayed value is approximately -0.761e-7, below the signal line near 0.1039e-6. The histogram has also turned increasingly negative during the latest sessions.
Together, these readings suggest sellers have gained ground in the short term. Both indicators however, cannot set the next move on their own. Later candles will indicate if selling pressure persists or slows down.
Price needs to get back on the bull market to experience a better recovery. If they move above the descending resistance, it will be a better sign of improvement. The chart remains bearish in the short term in a context of overall consolidation until that time.
The $0.000006 Threshold Returns to Focus
But when reached, a price threshold is different from keeping price above the threshold. The most recent price is near $0.0000053714 (a pullback from higher levels). Thus, the reported high does not create a support level above $0.000006.
The accompanying graph depicts an optimistic price story with rising candlesticks. It invites holders to communicate their future goals, but doesn’t set a higher end point. Nor does it include trading volume or detailed momentum readings.
The daily chart features additional context via trendlines and technical indicators. A continued recovery may resume recent highs, but a lack of support would detract from the setup. The triangle is still unresolved for now, and momentum readings are still to be monitored.