

- SHIB holds a rising support structure, but descending resistance leaves the recovery vulnerable until buyers confirm a sustained breakout.
- SHIB posted a 2.03% rise over the last 24 hours while trading volume declined by 31.24%, casting doubt on participation in the recovery.
- SHIB faces resistance near $0.00000620, while support around $0.0000050 and $0.0000045 could matter if selling pressure returns.
SHIB is hosting a critical technical crossroads with challenging trending to either side. Buyers must go to bat for support and against resistance to make direction.
SHIB Approaches a Critical Trendline Convergence
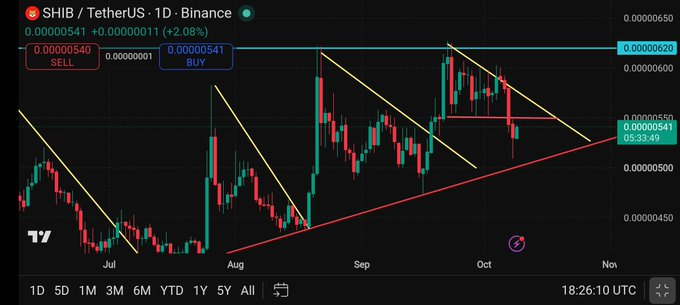
The chart traces a recovery from July lows near $0.0000035. SHIB subsequently climbed toward $0.00000620 during August before experiencing further volatility. Buyers have been unable to establish a handle on the stock near the top of its trading range in repeated pullbacks.
The red trendline is rising and joins progressively higher lows from summer into October. This structure suggests buyers have defended increasingly higher price levels during the recovery. A sustained break beneath that line would weaken the current bullish structure.
Meanwhile, descending yellow trendlines indicate resistance from lower highs. The competing boundaries suggest price is compressing within a narrowing range. However, the chart cannot establish when or in which direction a breakout will occur.
Price Performance and Trading Volume Offer Mixed Signals
SHIB’s displayed market data records a price of $0.000005448. The token held on to an early session weakness and rose 2.03% over 24 hours. However, sellers were active and price pulled back from the intraday highs.
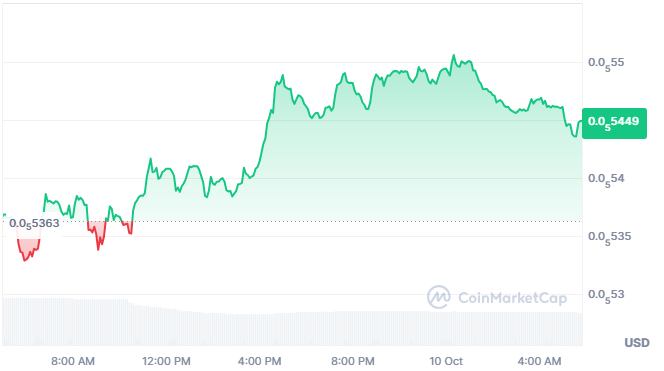
As seen in the intraday chart, the price is moving from around $0.00000536-$0.00000550. Buying pressure strengthened around midday and continued into the evening. A later pullback erased part of the advance without fully reversing the session’s gains.
Trading volume presents a more cautious picture. The positive price change was followed by a 31.24% drop in the displayed volume of 24 hours. Reduced volume could reflect less participation, but not necessarily a decline in buying volume.
The longer time frame chart shows a few periods of high volume followed by low volume. Activity in early March was over $5 billion, then a surge in late June was just below $4 billion. The unusual price jump near the chart’s end requires verification before it can support reliable conclusions.
Resistance and Support Define the Next Potential Move
The clearest overhead barrier remains near $0.00000620. SHIB has approached this level during previous rallies but failed to sustain a breakout. A confirmed daily close above resistance would provide stronger evidence of improving bullish momentum.
A move above the descending yellow trendline could also strengthen the recovery structure. Buyers would still need follow-through to demonstrate that resistance has been overcome. Without sustained demand, an initial breakout could fail and return price to consolidation.
On the other hand, a break of the rising red trendline could undermine the rising lows pattern. The chart places nearby reference areas around $0.0000050 and $0.0000045. These levels could attract attention if selling pressure pushes prices lower.
Bigger market data reveals SHIB’s market cap is nearly $3.21 billion. It has reported holders of 3.09 million and fully diluted valuation is in the vicinity of $3.21 billion. These numbers are a measure of market scale and not market direction.
The technical outlook for the SHIB Army is still indecisive, not bullish or bearish. Rising support favors the recovery, while descending resistance and lower trading volume warrant caution. A sustained breakout or breakdown would provide clearer evidence of the market’s next direction.


