
Short positions are approaching a five-year extreme! Why does the US stock market keep falling harder?

Why do the stock prices of some US companies keep falling even though their performance hasn’t clearly worsened?
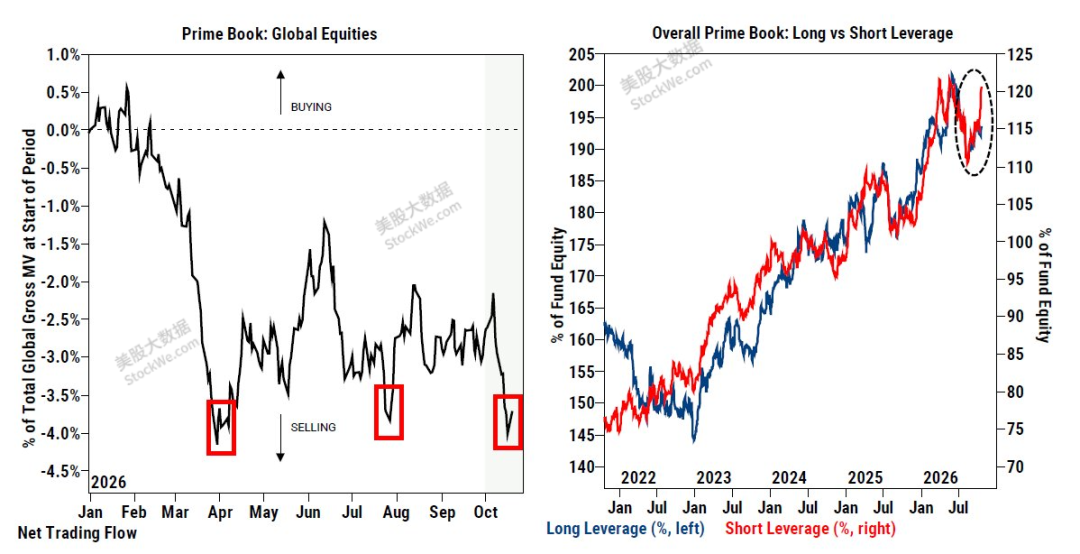
Goldman Sachs illustrated part of the reason in these two charts: institutions are rebalancing their positions, and when a large number of funds simultaneously reduce risk, the selling pressure can easily exceed the range that any single company's fundamentals can justify.
But similar positioning may also lead to a faster rebound. The key is to distinguish what is already happening and what conditions are still needed to trigger further moves.
How concentrated is this round of selling?
The left chart shows the cumulative net trading flow of global equities among Goldman Sachs’ prime brokerage clients, standardized by the initial total market value of holdings.
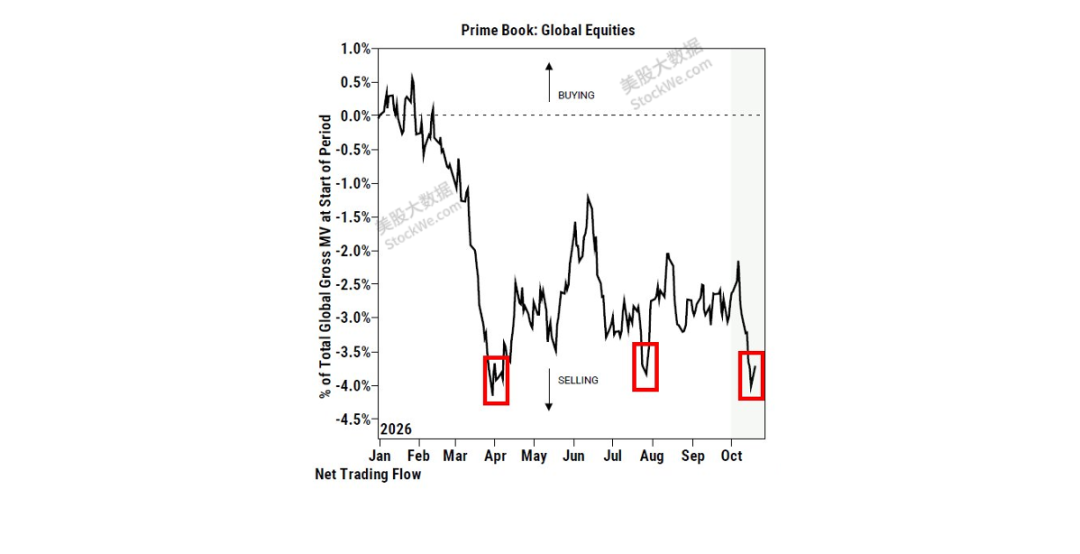
The black line moving downward represents net selling during this phase; upward represents net buying. The red boxes in April, August, and October each correspond to obvious selling periods. The latest dip has once again brought cumulative net flow close to the year’s lows.
Here’s a distinction: the line’s position reflects cumulative results, while the steepness of its decline reflects the selling speed during that period. Thus, being close to previous lows doesn’t equate to “record daily selling speed.”
At this point, you can understand why some stocks remain under pressure even without new negative news. When a batch of funds sells simultaneously, even good news from companies can be temporarily outweighed by selling pressure.
This chart reflects the trading activity of Goldman Sachs clients in global equities. It can't explain declines in every US stock, but it reminds us: When you see your holdings continually declining, don’t be quick to conclude you misjudged the company. First, distinguish between a deterioration in business fundamentals and a withdrawal of capital from that stock.
Institutions still hold long positions but are adding more protection
The blue line on the right chart is long leverage, the red line is short leverage, using the right and left vertical axes respectively. They measure long and short position value as a proportion of a fund’s net assets. You can’t directly compare the size of positions based on the height of these two lines.
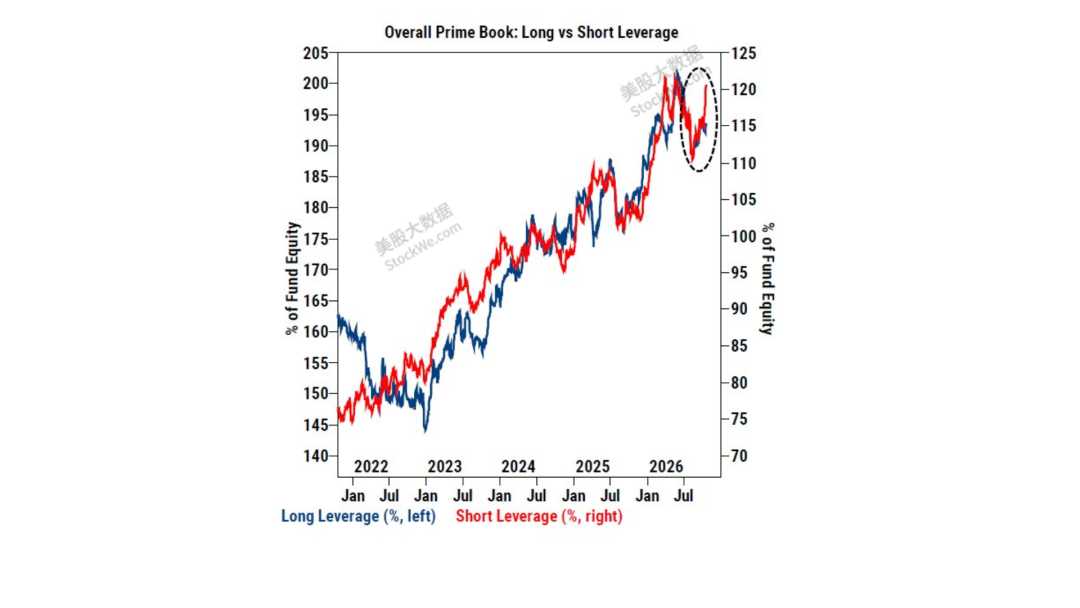
Long leverage remains elevated in the chart, while short leverage has obviously rebounded. According to other reports citing Goldman Sachs data, short leverage is now at the 99th percentile over the past five years—higher than about 99% of historical observations in this period.
This does not mean 99% of funds are bearish, nor does it mean there’s a 99% chance the market will decline. It means that the sample funds’ short exposure is already very high.
And these shorts may not all be direct bearish wagers, but could also be hedges against existing long positions. Institutions can be bullish about some companies’ long-term prospects, while increasing short positions in indexes or other stocks to lower portfolio dependence on the market’s rise.
Therefore, a more accurate understanding is:Funds are still involved in the market, but defenses against declines have significantly increased.
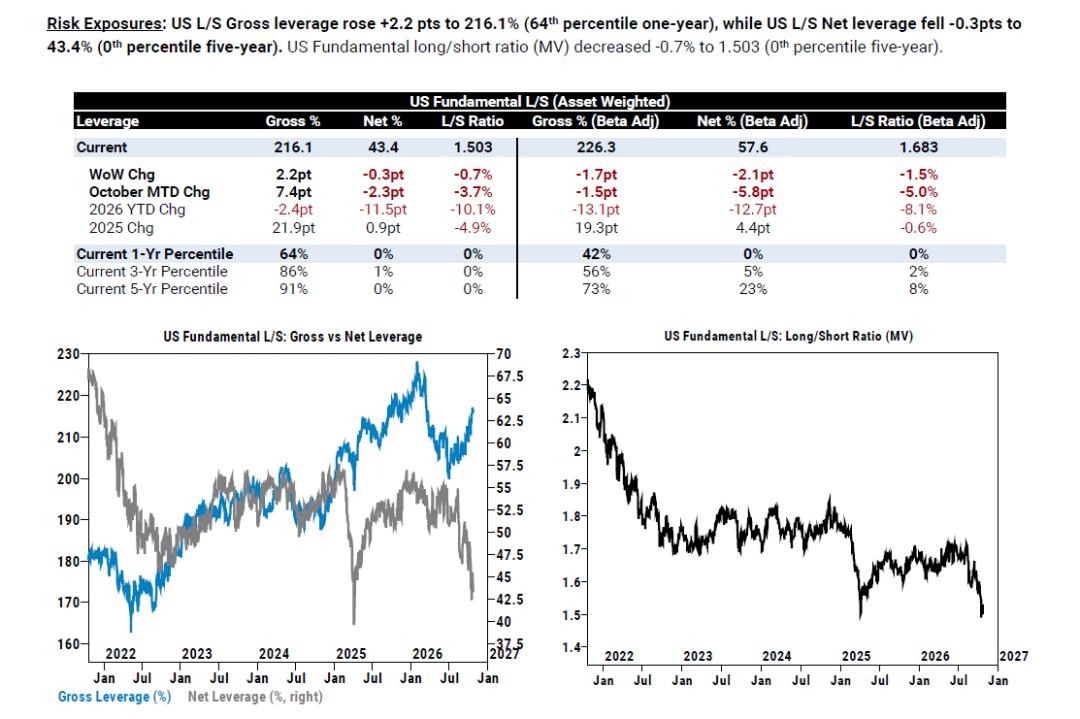
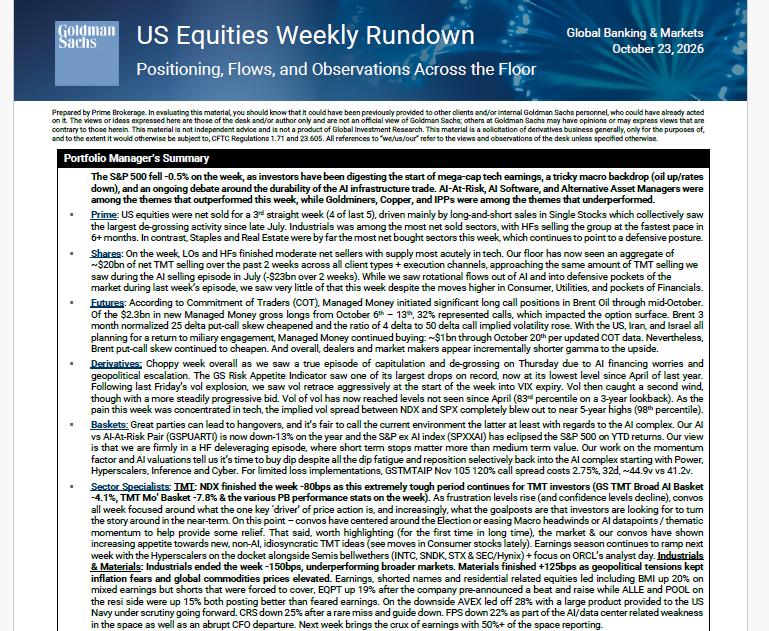
According to StockWe.com, US equities have experienced three consecutive weeks of net selling, along with the largest single-stock de-grossing (reduction in leverage) since late July.
Capital displays an extreme defensive stance—massively selling technology (TMT) and industrial stocks while heavily buying consumer staples and real estate (reaching the highest purchase level in five years).
This means that market sentiment is extremely cautious, and hedge funds are rapidly cutting risk exposure.
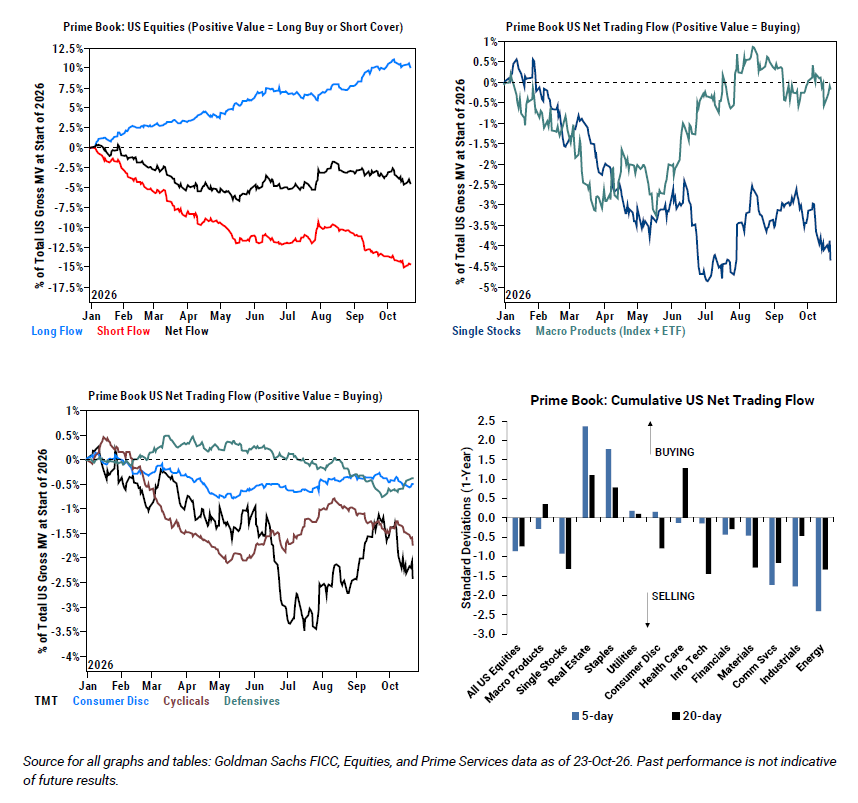
In the past two weeks, the TMT sector saw a net outflow of about $20 billion, approaching the extreme level of $23 billion seen during the big AI sell-off in July. This is a typical de-leveraging phase for hedge funds, where short-term stop-loss actions outweigh mid-term fundamental value.
According to Goldman Sachs, despite severe “dip-buying fatigue,” now is a time to selectively accumulate positions in electricity, hyperscalers, AI inference, and cybersecurity.
Why are good companies also being sold?
When funds face losses, increased volatility, or internal risk limits are triggered, managers often need to address the overall portfolio risk first.
In such cases, even a company that delivers a good earnings report may be sold. The reason may not be that the fund suddenly lost faith, but rather because the position is too concentrated, leverage needs to be reduced, or cash must be freed up.
Reuters reported that on October 22, the three strategies Goldman Sachs tracks—fundamental long/short, systematic, and multi-strategy funds—all experienced losses of over 1% that day; losses in crowded AI trades also pushed some funds to reduce leverage and risk exposure.
This type of adjustment can amplify market movements: price declines lead to losses, losses cause funds to cut positions, and cutting positions creates new selling pressure. For retail investors, the hardest part is that prices remain under pressure even though there is no new negative news.
However, we shouldn’t blame all declines on institutions, nor assume that funds are intentionally crashing the market or recouping losses through short selling.
StockWe.com believes this round of decline requires two perspectives: Concerns about AI ROI, financing costs, and more influence the valuations investors are willing to pay; meanwhile, institutional position adjustment may further magnify declines. Both can occur simultaneously.
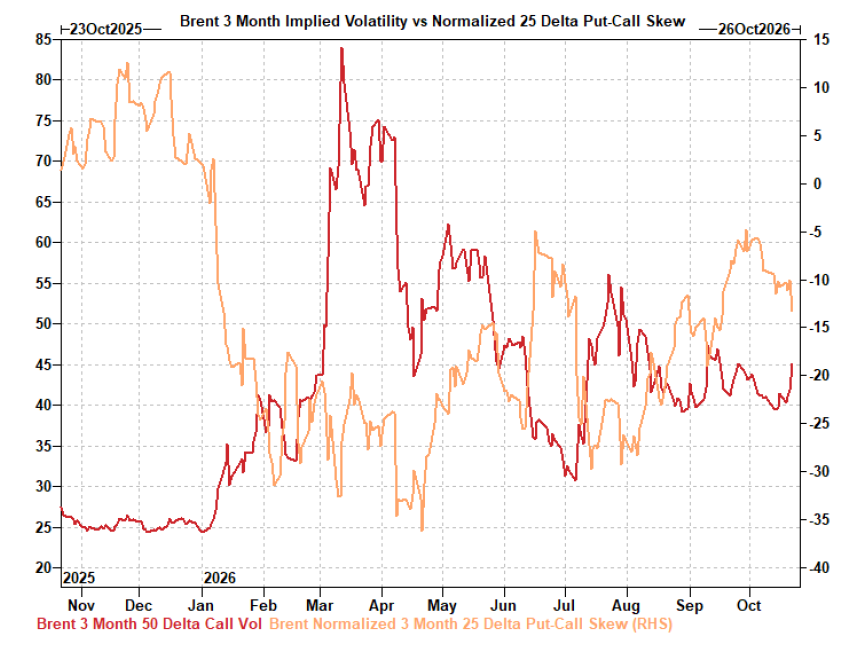
Why can high short interest also amplify rebounds?
After shorting stocks, investors usually need to buy back the shares to close positions. If the stock price starts rising, shorts face losses, and some funds may choose to cover.
When covering is concentrated, buying increases, pushing prices up further, which in turn forces more shorts to reassess their positions. This is why stocks that have fallen sharply may also rebound violently.
But high short interest only means there’s potential covering demand; it doesn’t mean buying will appear immediately. Funds can maintain their shorts, or after covering, rebuild positions. Without strong positive catalysts, crowded positions can last for a while.
The real observation should be: after positive news, can the stock price hold its gains? After short covering, are there still long-term buyers willing to continue accumulating? If only the former, sharp reversals are likely; if both happen together, the rebound is more likely to be sustained.
My view is that these two charts heighten our caution towards sharp rebounds, but they’re not enough to confirm a bottom. More directly, they remind us that current price fluctuations are impacted by institutional positioning, and shouldn’t all be attributed to changes in a company’s long-term value.
I remain positive on the long-term demand for AI infrastructure, but that confidence must be grounded in specific companies: Are clients still buying? Can projects be delivered? Is financing secure? Even if the industry direction is favorable, we need to distinguish which companies can retain growth.
Going forward, remain alert to further institutional selling, but don’t assume all opportunities are gone just because of consecutive declines. First assess if your holdings truly face a business downturn or are mainly hit by valuation and portfolio adjustment, then decide your next move.
Join StockWe.com VIP
Get first-hand information from Wall Street


After a busy day, you open the dashboard only to realize your US stocks have already surged or plummeted.
You scramble to check announcements and news, trying to figure out what happened.
But what if there was an AI financial expert team standing by for you 24/7, proactively providing analysis?
The StockWe AI "Financial Expert Team" is here!
There are five professional experts on stand-by
📊 Individual Stock Research Expert
📈 Industry Research Expert
🌍 Macroeconomic Research Expert
💼 Wealth Management Expert
📝 Live Trading Assistant
The key is: collaboration!
Here are some practical examples👇
① A US stock suddenly surges or plunges?
Just set the symbol and volatility trigger you care about.
Once triggered, the market monitoring expert will automatically summon the individual stock research expert to analyze the volatility, fundamentals, and follow-up metrics.
All you have to do is establish your own US stock monitoring pool. Our quantitative AI system will continuously track:
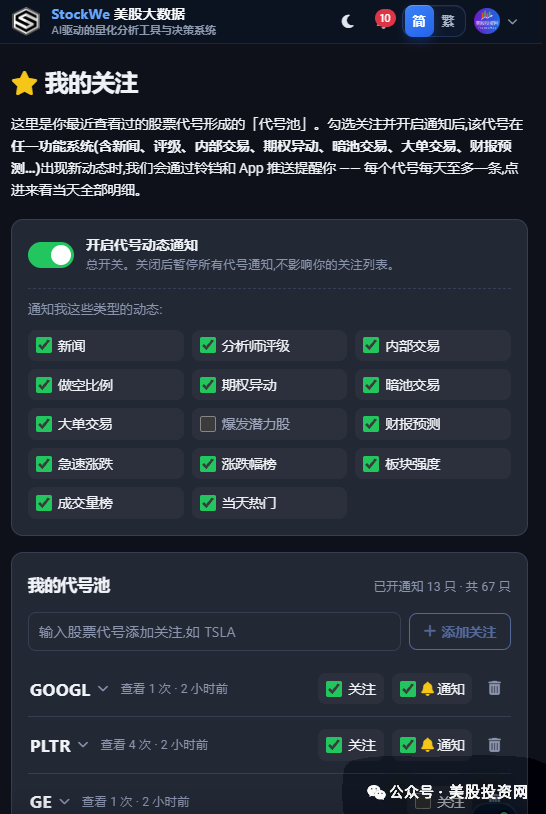
News, analyst upgrades/downgrades, insider trading, short interest, unusual options activity, dark pool trading, block trades, earnings forecasts, and rapid price moves.
For instance, if you follow NVDA, you can instantly see today’s news count, whether there was any options activity, and if dark pool or block trades changed—just click to view directly.
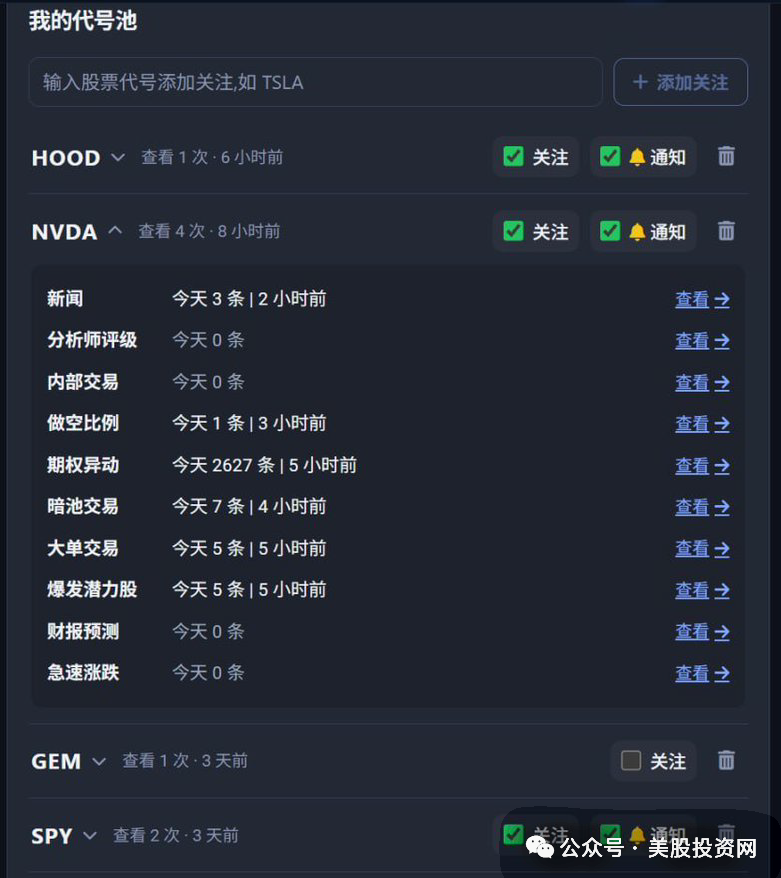
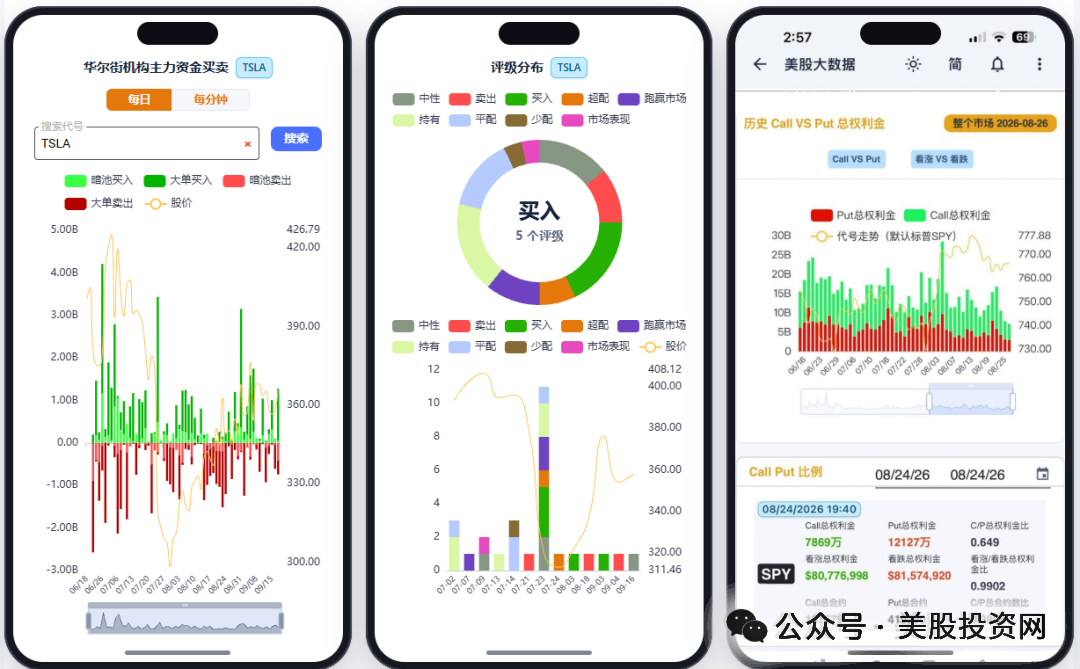
Even more importantly, after turning on APP notifications, you’ll be instantly notified whenever the stocks you follow see new developments.
Previously, you had to gather information everywhere yourself. Now, you can assign stock tracking to the system—work 24/7 for you.
For long-term holders, this is an individual equity alert system;
For swing traders and options players, it’s a real-time volatility radar.
Enter the ticker code—never miss an important change again.
Click the original link to download the APP



Disclaimer: The content of this article solely reflects the author's opinion and does not represent the platform in any capacity. This article is not intended to serve as a reference for making investment decisions.
You may also like
Goldman Sachs: Retail trading down 45% from late 2025, but household buying remains the "ballast" of U.S. stocks; maintains S&P 500 year-end bullish target at 8000 points
Goldman Sachs stated that while retail investors have significantly reduced stock trading in recent months, overall demand for stocks from U.S. households remains strong enough to support the market amid rising selling pressure and increasing stock supply.

Crypto market’s weekly winners and losers – M, YELLOW, BTW, UMXM
Ethereum leads tokenized fund sector with 47% market share

Jamie Dimon Hated Bitcoin: JPMorgan Now Expects BTC to Beat Stocks and Gold

Crypto prices
More


