
Opinion: Will gold be first smashed down to 3500, then pushed up to 7500 by policy?

FX168 October 27th Report—— Some market views suggest that in a true deleveraging shock, gold is first sold off along with risk assets, and gold mining stocks may face an even larger decline. This view uses $3,500 and $7,500 per ounce as references for extreme scenarios, emphasizing the second stage after policy responses.
Some market commentators believe that in a genuine deleveraging shock, gold is initially sold off together with risk assets, and gold mining stocks could suffer even greater losses. This perspective uses $3,500 and $7,500 per ounce as benchmarks for extreme scenario projections, emphasizing the second phase following policy responses.
Market View: Fall First, Rise Later, Not a One-sided Bull View
Recently, volatility in risk assets has increased, with tech stocks and speculative assets under pressure, and gold and gold mining stocks declining together. International market commentary suggests this does not invalidate the long-term bullish thesis, but rather represents the first stage of a deleveraging-driven liquidity shock. This view clearly splits the trajectory into two phases: a conditional initial drop and a subsequent rise contingent on policy responses. When discussing extreme crash scenarios, the commentary references $3,500 and $7,500 per ounce as benchmarks for the two-stage projection—these are not investment recommendations.
First Stage: Selling What Can Be Sold, Gold Mining Stocks More Vulnerable
This view argues that in true deleveraging, investors do not sell what they wish, but what they are able to; the need for margin calls, de-risking, and raising cash sparks indiscriminate selling of even high-quality assets. Gold is not immune, and gold mining stocks, being essentially equities with operational leverage, are more easily sold off than physical gold; their percentage drops may surpass those of gold. The view even discusses the possibility of gold mining stocks experiencing 20%, 30%, or deeper drawdowns in a broad market liquidation, while stressing this does not mean long-term theses are void.
Second Stage: Policy Response is the Variable
This view posits that the initial selloff is not the core issue; the key is what happens afterward. The financial system’s deep reliance on cheap credit and ample liquidity means that, under pressure from Federal debt, deficits, and interest costs, policymakers are more inclined to intervene than to continue tightening when faced with credit events, disorderly bond markets, major equity selloffs, or liquidity crises. Should the Federal Reserve respond with rate cuts, bond purchases, or liquidity tools, gold could rapidly surge from deleveraging lows toward or above $7,500 per ounce; gold mining stocks, due to operational leverage, may rally even more—assuming strong balance sheets, cost control, and solid business fundamentals. This perspective admits to uncertainty regarding the market bottom, drawdown, or timing of reversal, and does not advocate blindly catching falling knives.
Technical View: Weak Choppy Consolidation, Mid-term Resistance Persists
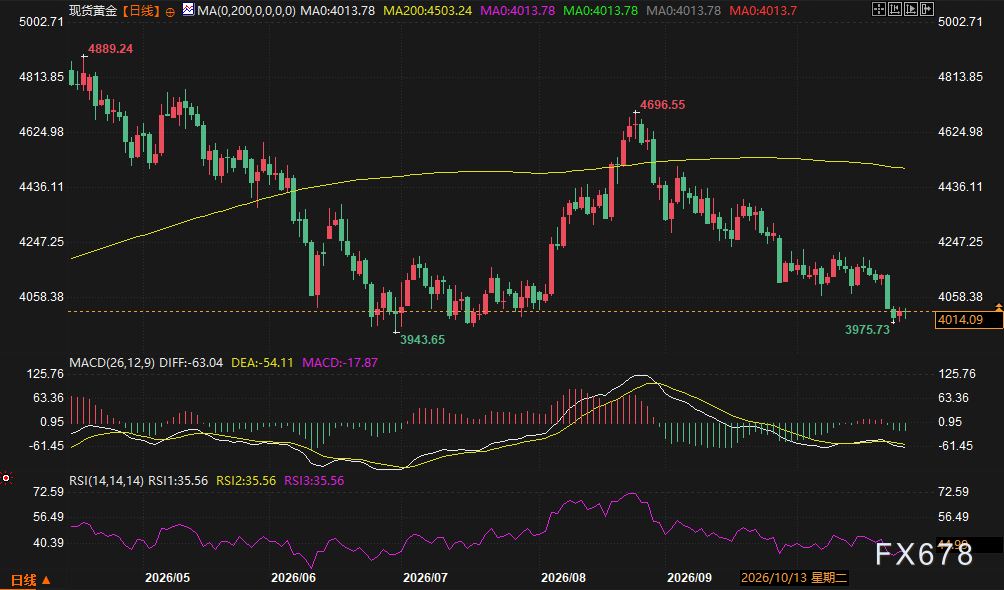
The daily chart shows gold falling back after peaking at high levels, with rebounds failing to break previous highs, followed by renewed weakness. Price now fluctuates around major psychological levels and previous lows, in a weak consolidation. Gold’s price is tangled around the 20-day moving average, still far below the annual moving average; long-term moving averages clearly resisted price during earlier rebounds, and the mid-term trend remains bearish. MACD is below the zero axis with narrowing green bars, indicating weakness but lessening downside momentum; RSI is neutral to weak, not yet oversold. In the short term, direction is unclear, with market discussion centered on whether psychological levels or previous lows will serve as support, and on potential rebounds observing the 20-day moving average and above; the technical outlook does not support equating a single day’s joint decline with a change in long-term logic.
QA
Q: Are $3,500 and $7,500 the baseline forecasts?
A: No. These figures are used as references for extreme scenarios: $3,500 reflects a discussion about sharp deleveraging declines, and $7,500 refers to the possible upside after aggressive policy easing; the view clearly states there is no prediction about the precise bottom or timing.
Q: Why might gold mining stocks fall even harder at first?
A: Gold mining stocks are equities with operational leverage and are more liquid than physical gold, making them easier to be sold off during deleveraging; however, operational leverage may also amplify upside during the policy response phase, provided balance sheets and cost controls are strong.
Q: What is the key condition for the ‘fall first, rise later’ thesis?
A: The key is not the selloff itself, but whether it triggers a sufficiently strong policy response. If the Federal Reserve maintains restrictiveness for longer or if a crash damages the fundamentals of mining companies, the subsequent rally could be delayed or may not materialize.
Q: What does the current technical picture support?
A: The daily chart still shows weak consolidation after a high-level retreat, with prices hovering around the 20-day moving average and well below the annual average; MACD is below zero with narrowing green bars, and RSI is neutral to weak but not oversold; short-term direction is unclear, and mid-term resistance remains significant.
Disclaimer: The content of this article solely reflects the author's opinion and does not represent the platform in any capacity. This article is not intended to serve as a reference for making investment decisions.
You may also like
Singapore Expands International Cooperation on Cross-Border Digital Asset Settlements



3 Explosive Crypto Picks to Stack: SUI, LTC, XLM

Crypto prices
More


