Crypto Academic: 11.3 Bitcoin (BTC) shorts can’t move the price anymore, but the bulls aren’t daring to attack yet. Is the main force feeling awkward right now?
The current price of Bitcoin at 77,400 doesn’t mean much by itself; what matters is that it’s stuck right where everyone is waiting. Bottom fishers are waiting for 76,000, top sellers are waiting for 78,000, and the 3,000 points in between is just a grinding machine for traders. Here’s my take: In the next 24 to 48 hours, it’s highly likely to fluctuate repeatedly between 76,300 and 78,800. Before a clear direction emerges, any feeling that it will rise or fall is just an illusion. Those who stick to their plan will profit, those who go by hunches will get burned. As always, this is pure technical sharing with no trading signals; manage your own leverage, and don’t come crying to me if you get liquidated. If this post gets 100 likes, I’ll update with the direction of this consolidation after tomorrow’s close.
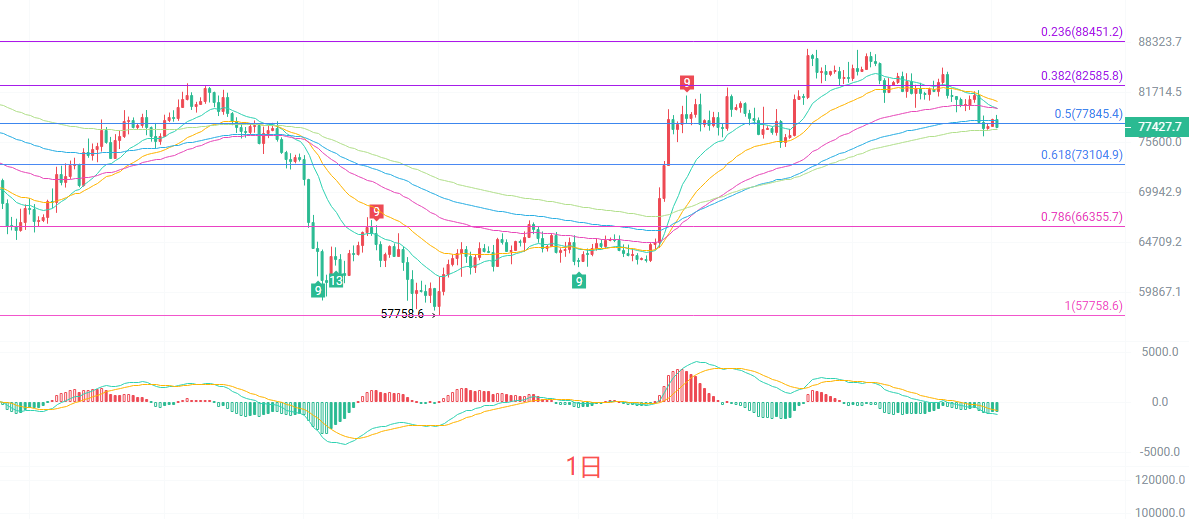
The daily K line body has completely wiped out the rebound from the past two days. Structurally, the price has already fallen below the EMA15 and EMA60, and is heading toward the EMA90 at 78,204. There's just one step left to reach the EMA120 at 77,098. The MACD on the daily chart shows that bearish momentum hasn't been fully released yet. The lower Bollinger Band at 76,817 is currently the most critical support level. The TD sequence is now at 5, following the count rule, only after two more candles could a low-9 appear. Overall assessment: the daily chart is in the pullback phase after a rebound—not a full reversal to bearishness yet—but the bulls need to defend the 76,800 level in the short term. If it fails, it will have to retest the upward structure since the previous low at 57,758.
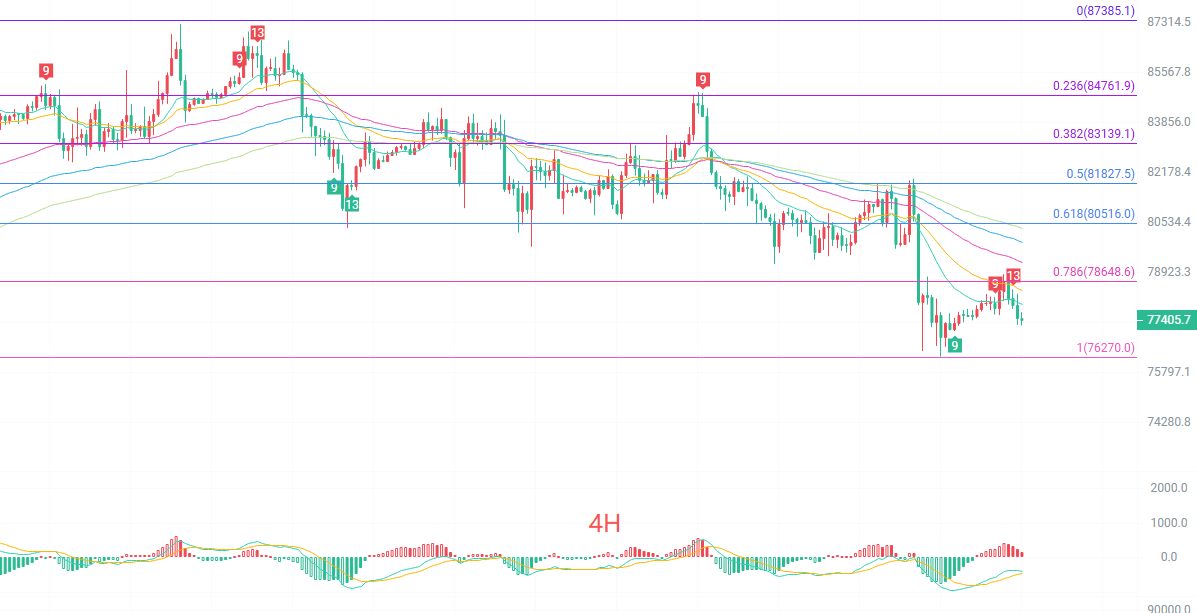
The current four-hour K line is almost flat, with both the high and low closing within the Bollinger Band channel. From the moving average standpoint, the price is suppressed below the EMA15 at 77,908, but the EMA30 at 78,362 has flattened, showing that short-term bears are also struggling around 78,000. On the MACD indicator, DIF has crossed above DEA, a typical signal of declining downward momentum and bearish exhaustion. With the Bollinger Bands tightening, the middle band at 77,674 is the key battleground: a reclaim means a short-term oversold rebound could start here; if not, continued grinding near the lower band at 76,895 is likely. There may be some further short-term dips, but there’s not much room left.
Short-term strategies:
Go long between 76,500 and 77,000 if there is resistance, stop loss at 500 points, target 77,500 to 78,500.
Go short between 78,300 and 78,800 if there’s resistance, stop loss at 500 points, target 77,000 to 76,500.
For specific operations, refer to real-time order book data. For more info, contact the author. There is a publishing delay, so this is for reference only—manage risks at your own discretion.