Bitcoin Price Eyes Next Breakout As The Bulls Aim For $70K
Bitcoin price climbed above the $66,000 resistance zone and started consolidation. BTC is now eyeing the next move above the $67,200 resistance zone.
- Bitcoin is eyeing a decent increase above the $67,200 resistance zone.
- The price is trading above $65,500 and the 100 hourly Simple moving average.
- There is a connecting bullish trend line forming with support at $65,900 on the hourly chart of the BTC/USD pair (data feed from Kraken).
- The pair could gain bullish momentum if it clears the $67,200 resistance zone.
Bitcoin Price Eyes More Upsides
Bitcoin price started a fresh increase above the $65,500 and $66,000 resistance levels. BTC even climbed above the $67,000 level. It traded as high as $67,200 and is currently consolidating gains.
There was a minor decline below the $66,500 level, but the price remained stable above the 23.6% Fib retracement level of the upward move from the $64,280 swing low to the $67,200 low. Bitcoin price is still trading above $65,500 and the 100 hourly Simple moving average .
There is also a connecting bullish trend line forming with support at $65,900 on the hourly chart of the BTC/USD pair. The trend line is near the 50% Fib retracement level of the upward move from the $64,280 swing low to the $67,200 low.
Immediate resistance is near the $67,000 level. The first major resistance could be $67,200. A clear move above the $67,200 resistance might send the price higher. The next resistance now sits at $68,500. If there is a clear move above the $68,500 resistance zone, the price could continue to move up. In the stated case, the price could rise toward $70,000.
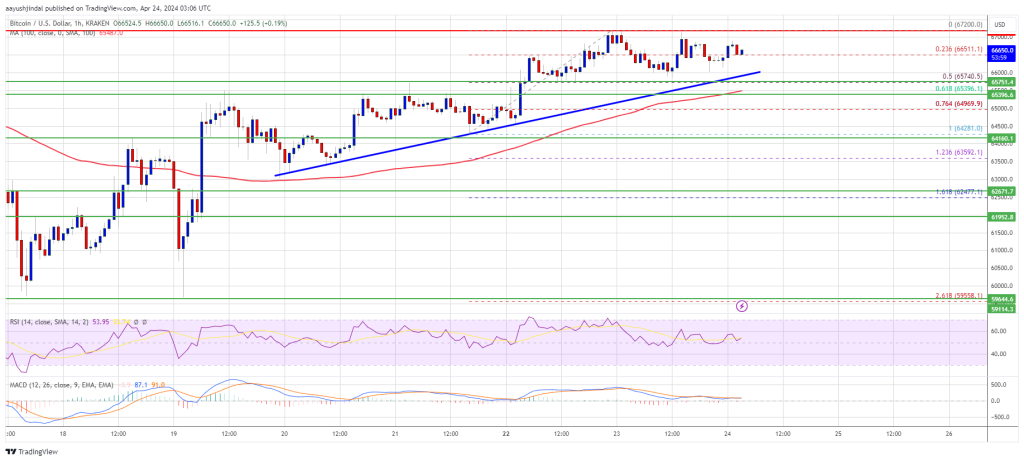
Source: BTCUSD on TradingView.com
The next major resistance is near the $70,500 zone. Any more gains might send Bitcoin toward the $72,000 resistance zone in the near term.
Are Dips Limited In BTC?
If Bitcoin fails to rise above the $67,000 resistance zone, it could start a downside correction. Immediate support on the downside is near the $66,200 level.
The first major support is $66,000 or the trend line. If there is a close below $66,000, the price could start to drop toward $65,400. Any more losses might send the price toward the $64,200 support zone in the near term.
Technical indicators:
Hourly MACD – The MACD is now losing pace in the bullish zone.
Hourly RSI (Relative Strength Index) – The RSI for BTC/USD is now above the 50 level.
Major Support Levels – $66,200, followed by $66,000.
Major Resistance Levels – $67,000, $67,200, and $68,500.
Disclaimer: The content of this article solely reflects the author's opinion and does not represent the platform in any capacity. This article is not intended to serve as a reference for making investment decisions.
You may also like
Tether financial analysis: Needs an additional $4.5 billion in reserves to maintain stability
If a stricter and fully punitive approach is applied to $BTC, the capital shortfall could range from 1.25 billion to 2.5 billion USD.

The fundraising flywheel has stalled, and crypto treasury companies are losing their ability to buy the dip.
Although the treasury companies appear to have ample resources, the disappearance of stock price premiums has cut off their financing channels, causing them to lose their ability to buy the dip.

Nearly 10,000 bitcoins withdrawn from exchanges, is the market about to change direction?