Ethereum shows signs of a potential bottom near $3,850: low 1-day RSI, sustained negative daily funding and deeply bearish market sentiment align with a retest of the weekly breakout, creating a bottoming zone where traders may scale into positions cautiously.
-
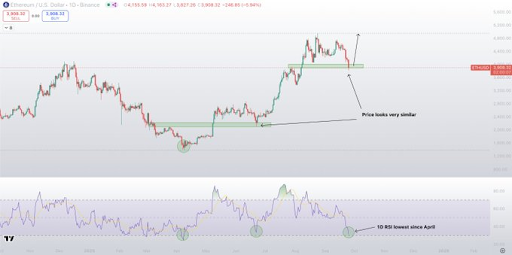
1-day RSI at lows last seen during the $1,350 bottom, signaling oversold conditions.
-
Negative daily funding during the uptrend has historically confirmed bottoms six of seven times.
-
Price retest of the $3,850 breakout and widespread bearish sentiment point to a bottoming zone opportunity.
Ethereum bottom near $3,850: low RSI, negative funding and bearish sentiment align—learn how traders can scale into a potential bottom zone today.
What is signaling an Ethereum bottom near $3,850?
Ethereum bottom signals include a 1-day Relative Strength Index (RSI) reaching levels last observed at the $1,350 low, persistent negative daily funding during the uptrend, and a retest of the $3,850 weekly breakout. These combined data points and bearish sentiment suggest a defined bottoming zone for staged entries.
How do RSI and funding rates confirm a bottom?
Low 1-day RSI readings often indicate oversold conditions and potential price stabilization when paired with structural support. On the funding side, negative daily funding during an uptrend has matched historical bottoms six of seven times, providing a recurring technical signal traders use to validate support.
Analyst Sykodelic notes Ethereum’s potential bottom near $3,850, backed by low RSI, negative funding, and bearish sentiment alignment.
- Sykodelic notes Ethereum’s 1-day RSI hits lows last seen during $1,350 bottom, signaling potential support and bottoming zone for traders.
- Negative daily funding during the uptrend has historically confirmed bottoms six of seven times, reinforcing Ethereum’s current support level, says Sykodelic.
- Market sentiment remains deeply bearish while Ethereum retests $3,850 breakout, aligning data and sentiment, highlighting a bottoming zone opportunity, according to Sykodelic.
Ethereum’s market shows potential bottoming signals, supported by both technical data and sentiment analysis. Defining a bottoming zone helps investors scale positions over multiple days and reduce single-entry risk. Current metrics are rarely seen since earlier major lows and merit cautious attention.
Why does the $3,850 retest matter?
Retests of breakout zones often confirm whether a previous resistance converts to support. If price holds at $3,850, it typically indicates consolidation and a possible base for future upward movement. Traders watch retests to set measured entries and stop levels.
Technical Indicators Signal Potential Bottom
Ethereum’s 1-day RSI is reaching levels last observed during the $1,350 bottom amid prior market stress. Low RSI values commonly indicate oversold conditions and are used by analysts to anticipate stabilization.
Source: X
Data also shows persistent negative funding on the 1-day timeframe. Historical patterns show negative daily funding during uptrends has correctly predicted price support in six of seven comparable instances. Traders use these recurring signals to validate bottom zones.
Sentiment Indicates Market Pessimism
Social metrics and market surveys show pronounced bearish sentiment around short-term Ethereum direction. Such pessimism, when it coincides with technical support signals, often marks improved risk-to-reward for layered entries.
Sykodelic, a market analyst referenced for these observations, argues that the convergence of technical indicators and negative sentiment strengthens the case for a bottoming zone. This alignment gives traders a framework to plan scaled entries rather than single large positions.
Strategic Bottom Zone Considerations
Defining a bottom zone focuses on a range rather than an exact price. Traders scale in across days to lower exposure to intraday volatility. Historical Ethereum bottoms commonly showed low RSI, negative funding, and retested breakout levels—patterns that can inform present strategies.
Key recurring measures to monitor:
- 1-day RSI comparisons to prior major lows
- Daily funding rate trends and persistence
- Retest behavior at the $3,850 weekly breakout
- Market sentiment metrics and social indicators
Frequently Asked Questions
How reliable is a 1-day RSI for spotting bottoms?
1-day RSI is a useful short-term oversold indicator but should be combined with funding rates and support retests. Alone it can produce false signals; combined signals historically provide stronger confirmation for bottom zones.
What does negative daily funding mean for traders?
Negative daily funding implies shorts paying longs, signaling bearish positioning. When negative funding persists during an uptrend, historical precedent shows it can coincide with local bottoms—used as a confirmation tool alongside price action.
Key Takeaways
- Confluence matters: RSI, funding and sentiment alignment strengthens bottom signals.
- $3,850 is critical: Holding this retest supports the bottoming-zone thesis.
- Scale in: Use multi-day layering to reduce single-entry risk and manage volatility.
Conclusion
Ethereum exhibits technical and sentiment signals consistent with a potential bottom near $3,850. Traders should monitor 1-day RSI, daily funding trends and the weekly breakout retest while scaling positions across days. Watch for confirmation from combined indicators before increasing exposure.