Will Ethereum’s Slide Deepen as Banking Stress Spreads?
Ethereum price daily chart is flashing a warning just as credit markets start to shake again. Regional bank stress, fraudulent loan write-offs, and rising credit losses are reviving 2023-style contagion fears. The question is whether this fresh wave of financial tension could push risk assets—especially crypto—into another correction phase.
Ethereum Price Prediction: How the Banking News Links to ETH’s Drop
The Zions Bancorp fraud revelation and the collapse of auto-sector lenders like Tricolor and First Brands spooked investors this week. When regional banks stumble, liquidity tightens, credit availability shrinks, and speculative assets feel the heat. Crypto is often the first to sell off when the market smells financial instability.
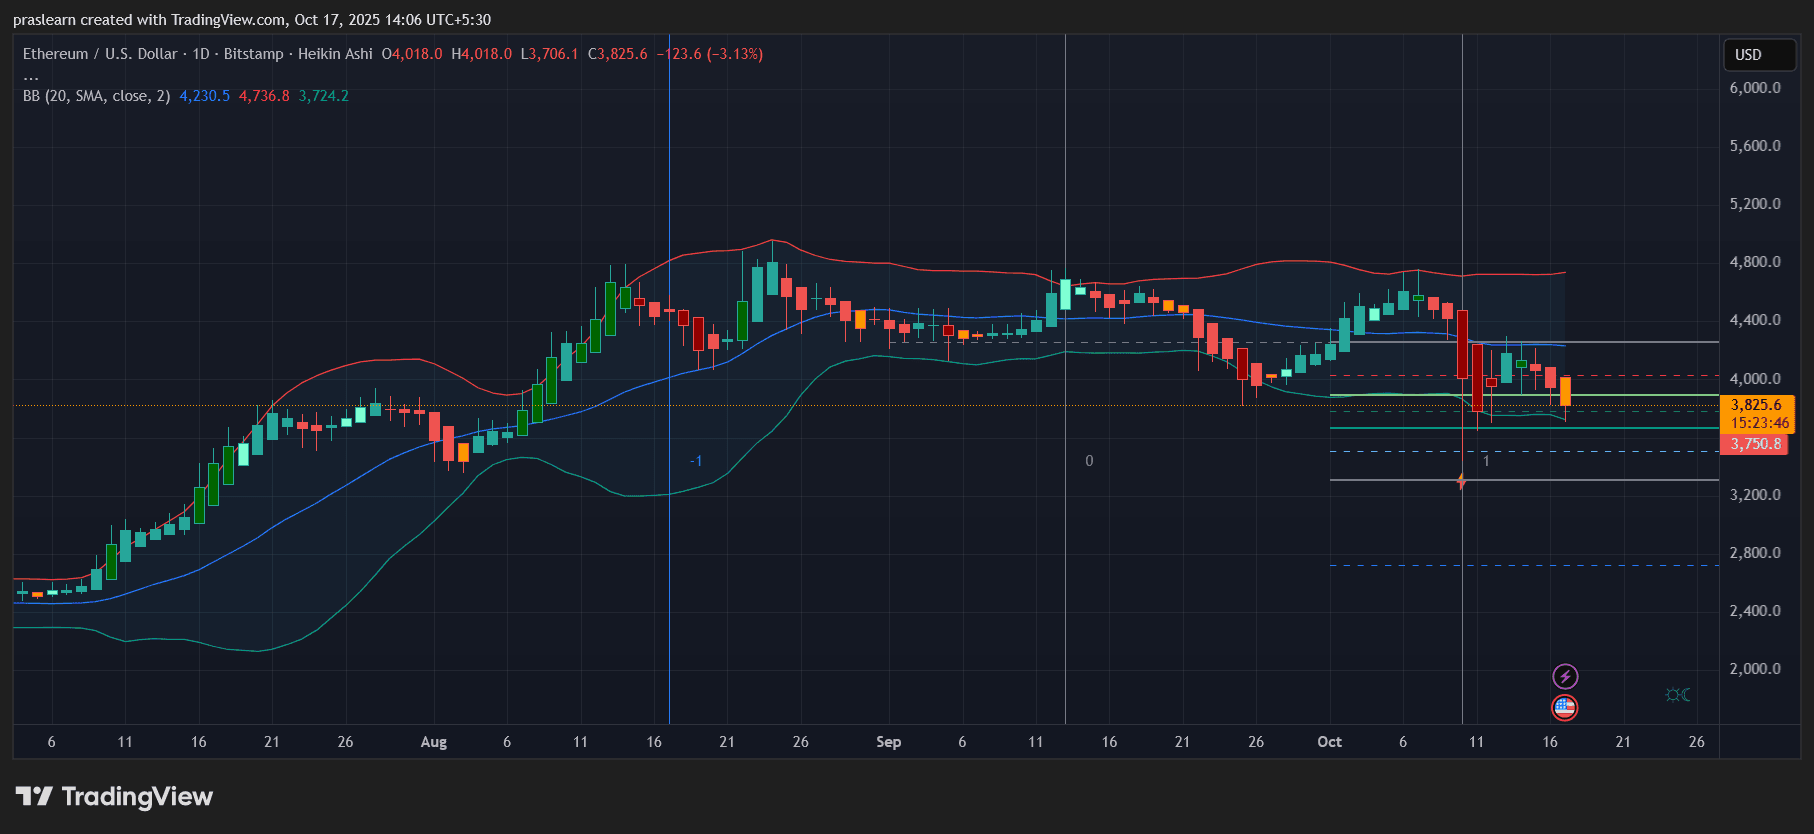
Ethereum’s 3.13% daily drop to around 3825 mirrors that sentiment. It’s not just a technical pullback—it’s the market pricing in credit risk. Each time banking fragility surfaces, traders move capital from high-beta assets like ETH into cash, short-term Treasuries, or dollar-pegged stablecoins.
If this banking stress worsens, the risk-off flow could pressure ETH toward the next support band near 3750 and potentially the 3400–3500 zone.
Ethereum Price Prediction: What the ETH Price Daily Chart Reveals
 ETH/USD Daily Chart- TradingView
The Heikin Ashi candles show clear momentum loss since early October. The trend turned bearish after multiple failed attempts to reclaim the 4200 zone.
The Bollinger Bands (BB 20,2) tell the story in numbers:
- The middle band near 4230 acts as dynamic resistance.
- The lower band at roughly 3724 aligns closely with current price, showing ETH testing the bottom envelope.
- The upper band at 4736 is now far out of reach—typical in a down-momentum phase.
Ethereum price has printed two consecutive red candles with long upper wicks, confirming rejection above 4000. Volume tapering suggests weak buying interest, and the recent lower lows confirm bearish continuation.
Unless ETH closes decisively above 4100, the bias remains short to neutral.
Where Are the Next Key Levels?
Immediate support sits at 3750, which coincides with the lower Bollinger boundary and prior consolidation from early August.
If that fails, the next critical area is 3400–3450, where historical demand zones could offer a temporary bounce.
On the upside, ETH price must reclaim 4100 to invalidate the current bearish structure. A daily close above the middle band (around 4230) would be the first sign that buyers are stepping back in.
Macro Risk: The Banking Contagion Angle
This latest banking stress story is not isolated. Zions’ $50 million write-off adds to a pattern—small cracks appearing across regional and subprime credit markets. When one lender exposes fraud, others scramble to check their books. That ripple effect often tightens liquidity across financial systems, even if regulators step in.
Historically, crypto thrives on liquidity and confidence. Remove either, and volatility spikes downward. If more regional banks disclose credit write-offs tied to non-bank lenders, the Federal Reserve may face a dilemma: ease policy to stabilize credit or stay tight to fight inflation. Either path adds uncertainty—something traders usually sell first and question later.
Ethereum Price Prediction: What to Watch Next?
- Bank Earnings Reports – Any rise in loan loss provisions will strengthen the bearish case for risk assets.
- U.S. Treasury Yields – If yields keep rising, capital will continue to exit crypto.
- ETH 3750 Zone – A clean daily break below that level could accelerate downside momentum.
Short term (next 10–15 days): ETH price likely trades between 3750 and 4100, with lower volatility but negative bias. Medium term (next 30–45 days): If banking fears deepen, $Ethereum could retest 3400–3450, followed by a relief rebound toward 3900–4000.
Longer term, Ethereum’s fundamentals remain intact , but markets move on liquidity—and right now, liquidity is draining from the system. Until credit markets stabilize, expect ETH to remain under pressure.
Ethereum’s current price action isn’t random—it’s reacting to real-world financial stress. The next few weeks will reveal whether this is a passing tremor or the start of a deeper liquidity crunch that drags $ETH closer to 3400.
Disclaimer: The content of this article solely reflects the author's opinion and does not represent the platform in any capacity. This article is not intended to serve as a reference for making investment decisions.
You may also like
Mastercard profit rises on sustained transaction volumes
MasterCard: Fourth Quarter Earnings Overview
Bitcoin Holds Steady at $88K Even as Dollar Hits Year-Low and Gold Reaches Record
Pharos Announces Alibaba Cloud, AWS, and Leading Web3 Firms as Security Partners
