Bitcoin Hits Key Support; Analysts Warn of Deeper Correction

Bitcoin has retreated to a critical $107,000 level, defined by on-chain analysis as a pivot point for a medium-term correction. Derivatives data shows a fragile market balance tilting toward selling.
Bitcoin’s price is undergoing a market correction. On Tuesday, it retreated to $107,000 after briefly breaking above $111,000 the previous day.
On-chain data analysts now identify the current price range as a crucial inflection point. This point will determine whether the asset maintains its bullish trend or faces a moderate, medium-term correction.
A Critical Juncture for Bullish Momentum
On-chain data analysis platform Glassnode highlighted this situation by sharing its Cost Basis Distribution Quantile Model chart on X.
This model analyzes the distribution of Bitcoin investors’ acquisition costs to assess the likelihood of profit-taking at the current price level. Unlike traditional technical analysis, this tool uses actual blockchain data to identify accumulation patterns, offering a more precise view of institutional support and resistance zones.
The chart features several quantile lines, such as the 0.95 line (Red). This line represents the average price paid by the top 5% of Bitcoin holders—those with the highest cost basis.
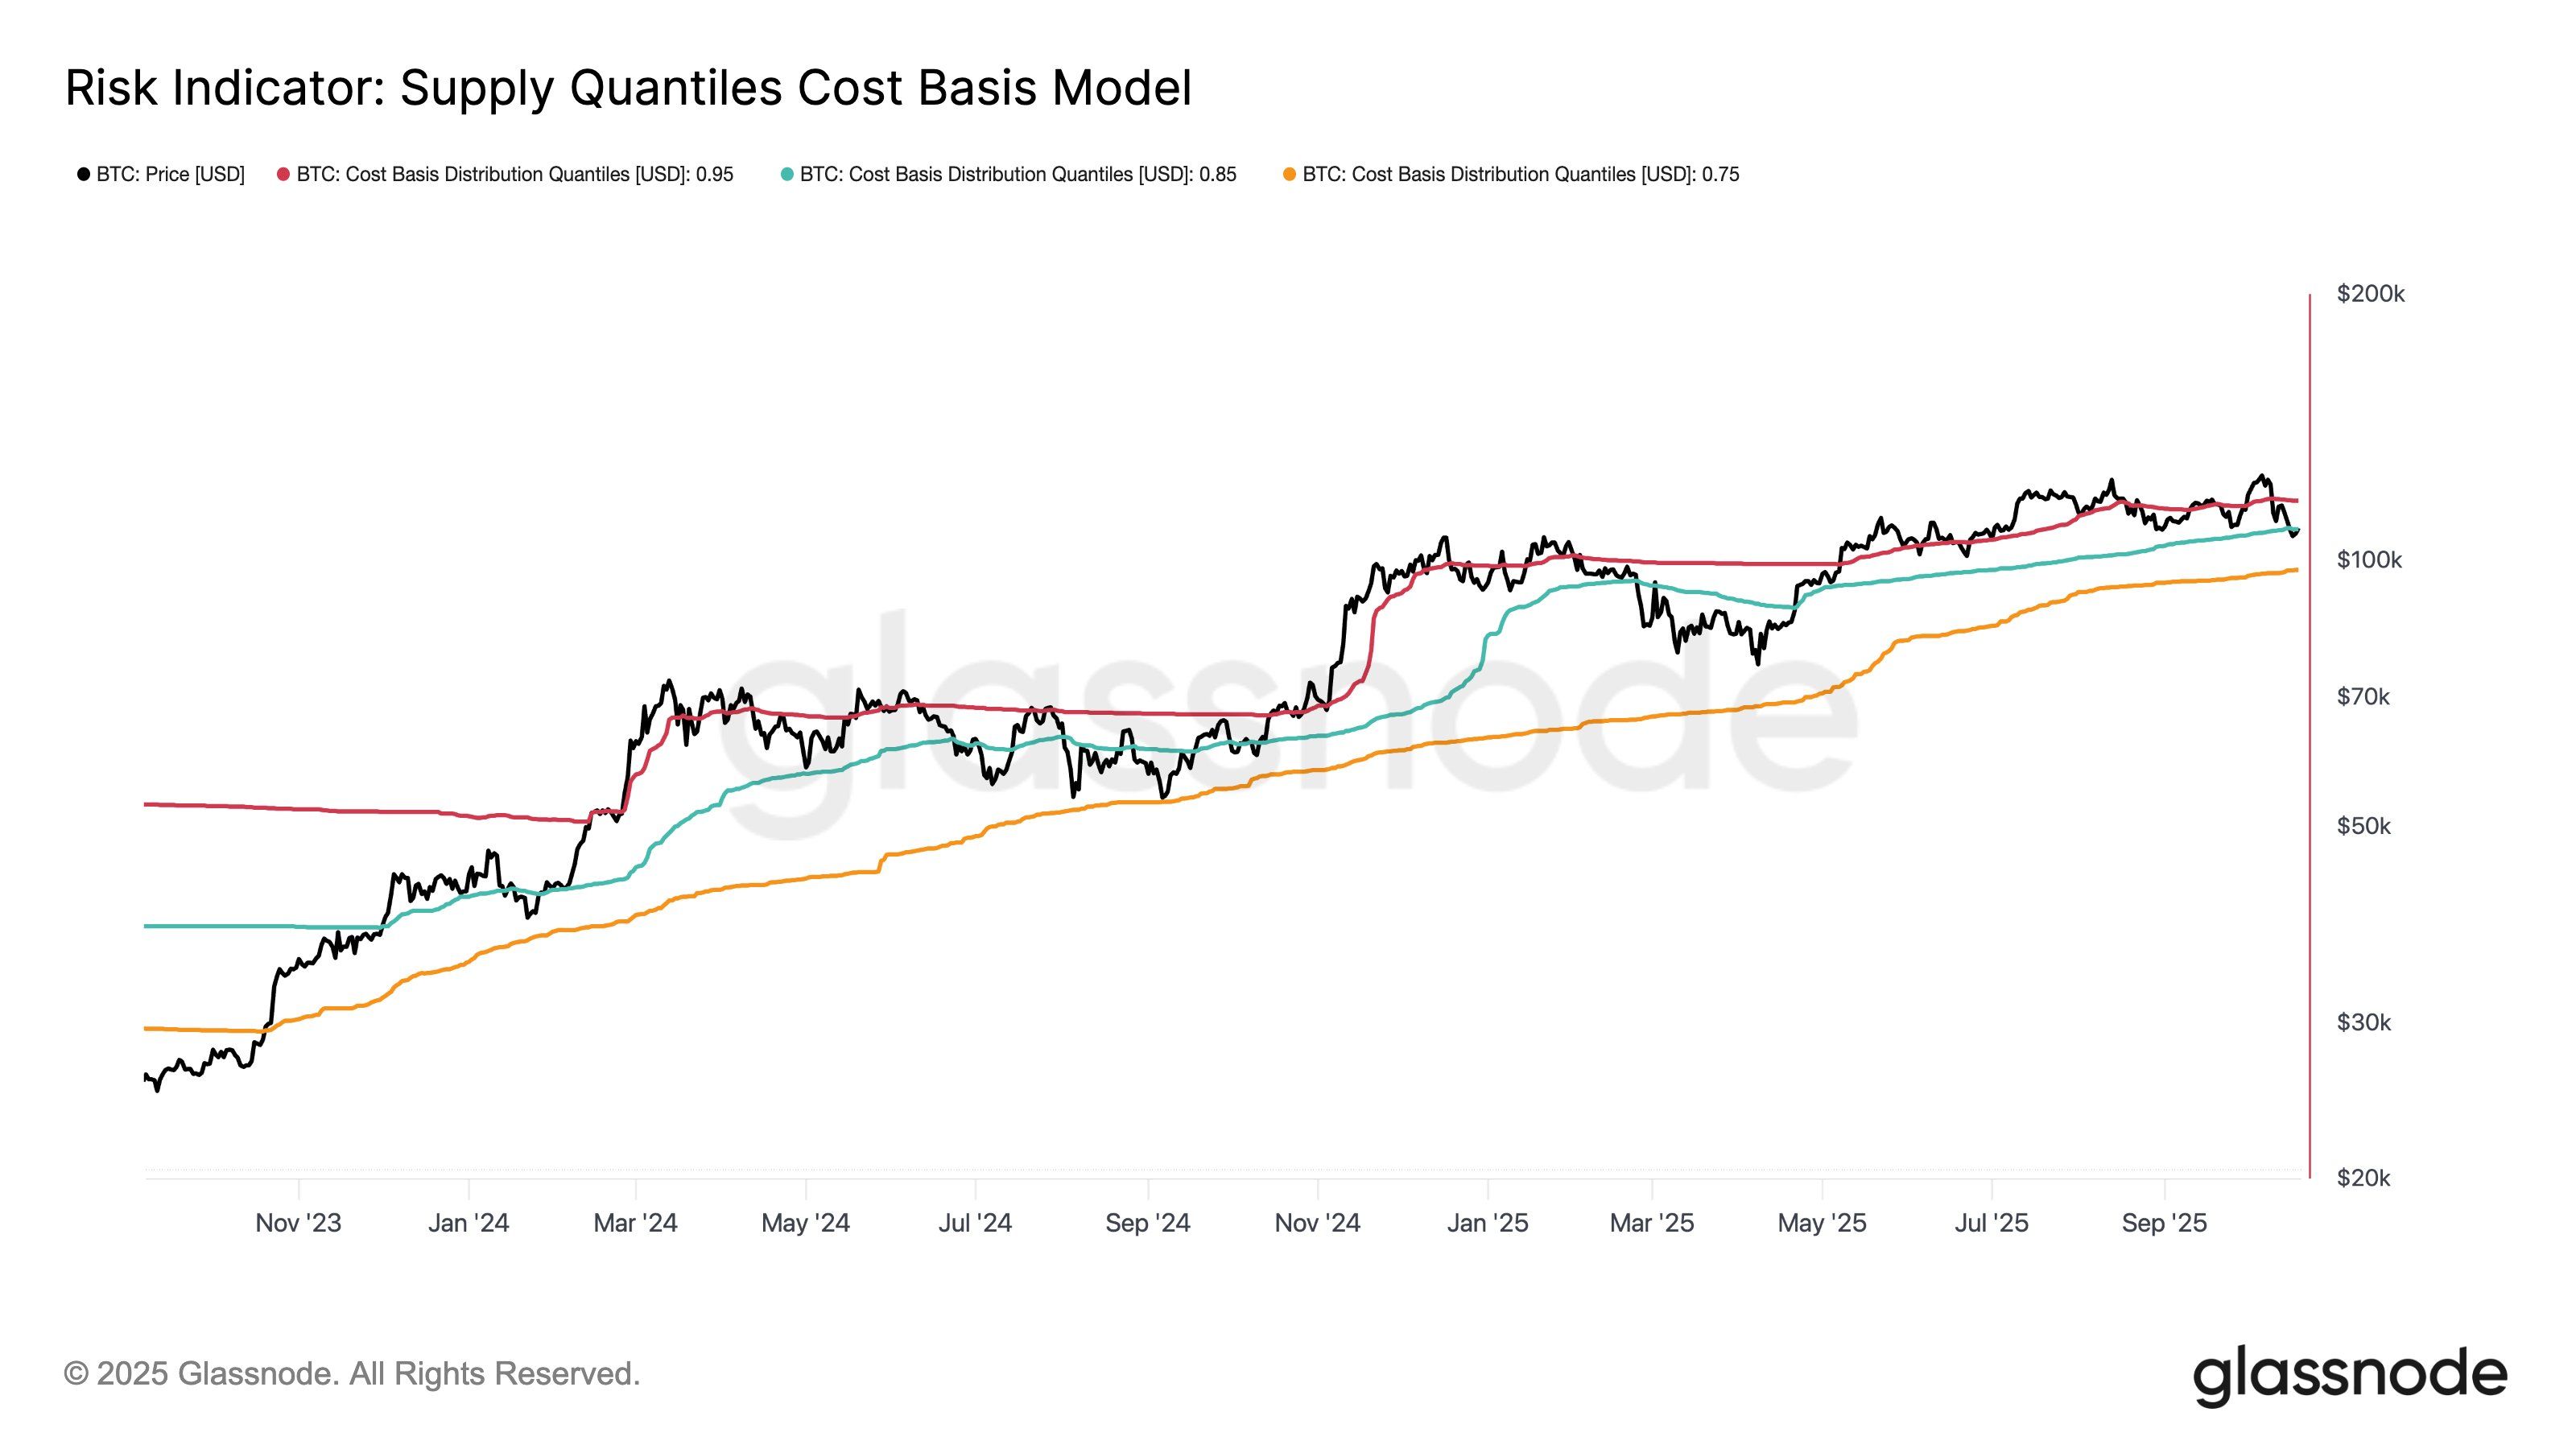 Risk Indicator: Supply Quantiles Cost Basis Model. Source: Glassnode
When the Bitcoin price moves above this 0.95 line, it signals an overheated market and a high-risk zone where profit realization (selling) will likely increase. Conversely, when the price drops below the 0.95 line, the market enters a trend transition or equilibrium state. This is precisely where Bitcoin landed after the October 10 flash crash.
The Pivot Point: The 0.85 Quantile
The current price level is hovering near the 0.85 quantile boundary. This is a kind of key support. A sustained break below this line is typically interpreted as an expanded risk of a medium-term correction.
Glassnode cautioned, “If buyers can hold this zone, momentum can rebuild from here. But lose it again, and the market likely revisits lower territory. This is a pivotal area to watch.”
Derivatives Traders Position for Further Downside
Investor sentiment on Binance, the largest cryptocurrency derivatives platform by volume, also leans toward anticipating further adjustments.
Arab Chain, an analyst at CryptoQuant, noted, “October saw an increase in Bitcoin futures trading volume on Binance, with sellers dominating most days until yesterday.”
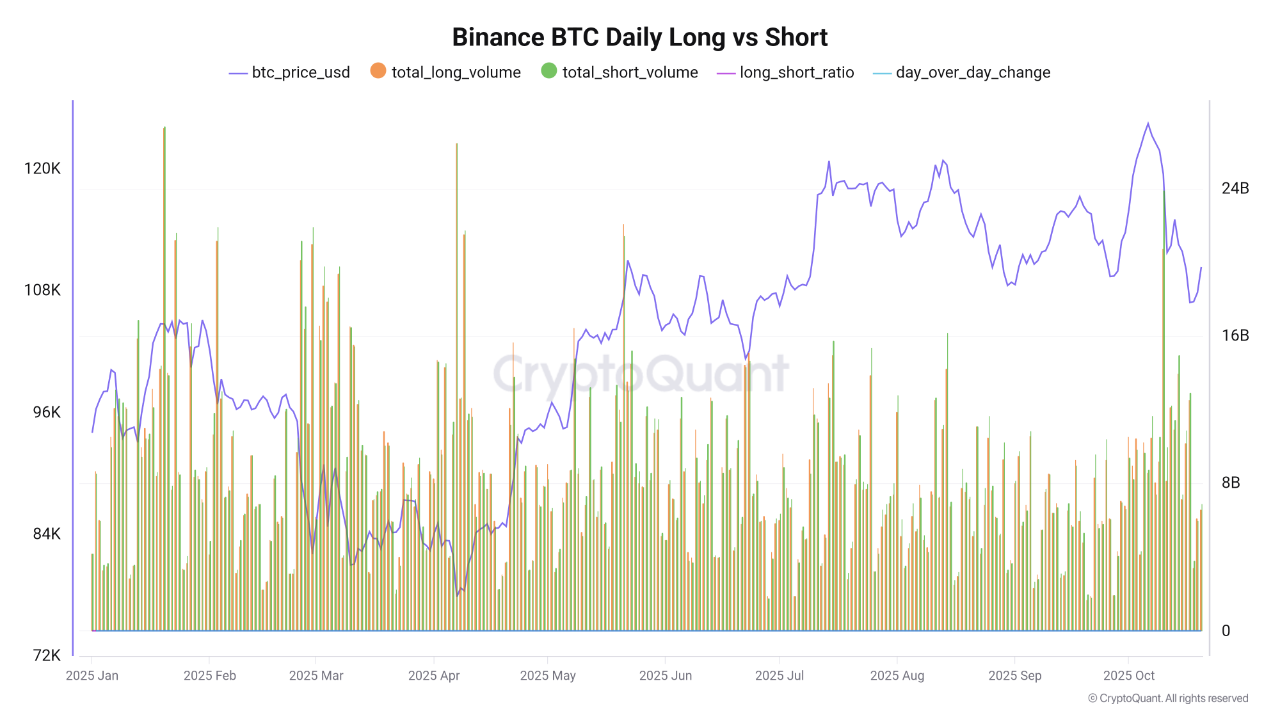 Binance BTC Daily Long vs Short. Source: CryptoQuant
Binance Bitcoin futures positions are currently slightly tilted toward the sell-side, shifting from a near 50:50 balance. The current long/short ratio sits at 0.955, and the Day-over-Day Change (DOC) of -0.063 signals a deceleration of positive momentum.
Arab Chain concluded, “Overall, the current data reflects a fragile balance between buyers and sellers, slightly tilted in favor of selling pressure. If this trend continues, it could pave the way for further corrections unless the market shows renewed buying activity or stronger institutional demand in the coming days.”
Disclaimer: The content of this article solely reflects the author's opinion and does not represent the platform in any capacity. This article is not intended to serve as a reference for making investment decisions.
You may also like
ADA, ETH, XRP Climb as Bitcoin Zooms Above $93K, But Traders Warn of ‘Fakeout Rally’
Last Cycle’s Signal King Murad: 116 Reasons Why the 2026 Bull Market Will Come
I do not agree with the view that the market cycle is only four years; I believe this cycle may extend to four and a half or even five years, and could last until 2026.

Ethereum completes Fusaka upgrade, team claims it can unlock up to 8x data throughput
Major upgrades, which used to take place once a year, are now happening every six months, demonstrating that the foundation still maintains strong execution capabilities despite recent personnel changes.

Glassnode: Is Bitcoin Showing Signs of a 2022 Crash Again? Beware of a Key Range
The current bitcoin market structure is highly similar to Q1 2022, with over 25% of on-chain supply in a loss, ETF capital flows and spot momentum weakening, and the price relying on key cost basis areas.