- XRP trades near $1.89 after losing the $2.00 level, pushing price into the final support of its year-long structure.
- Spot outflows surged to $54.7M, marking one of the largest distribution days of 2025 as sellers accelerate exits.
- XRP trades below the 20, 50, 100, and 200-day EMAs, with a trendline rejection confirming deeper downside risk toward $1.85.
XRP price today trades near $1.89 after sliding through the $2.00 psychological mark, extending a sharp decline driven by persistent spot outflows and a clean rejection from the descending trendline. The move places immediate pressure on buyers as price tests the final support of the year-long ascending structure.
Spot Outflows Spike As Distribution Accelerates
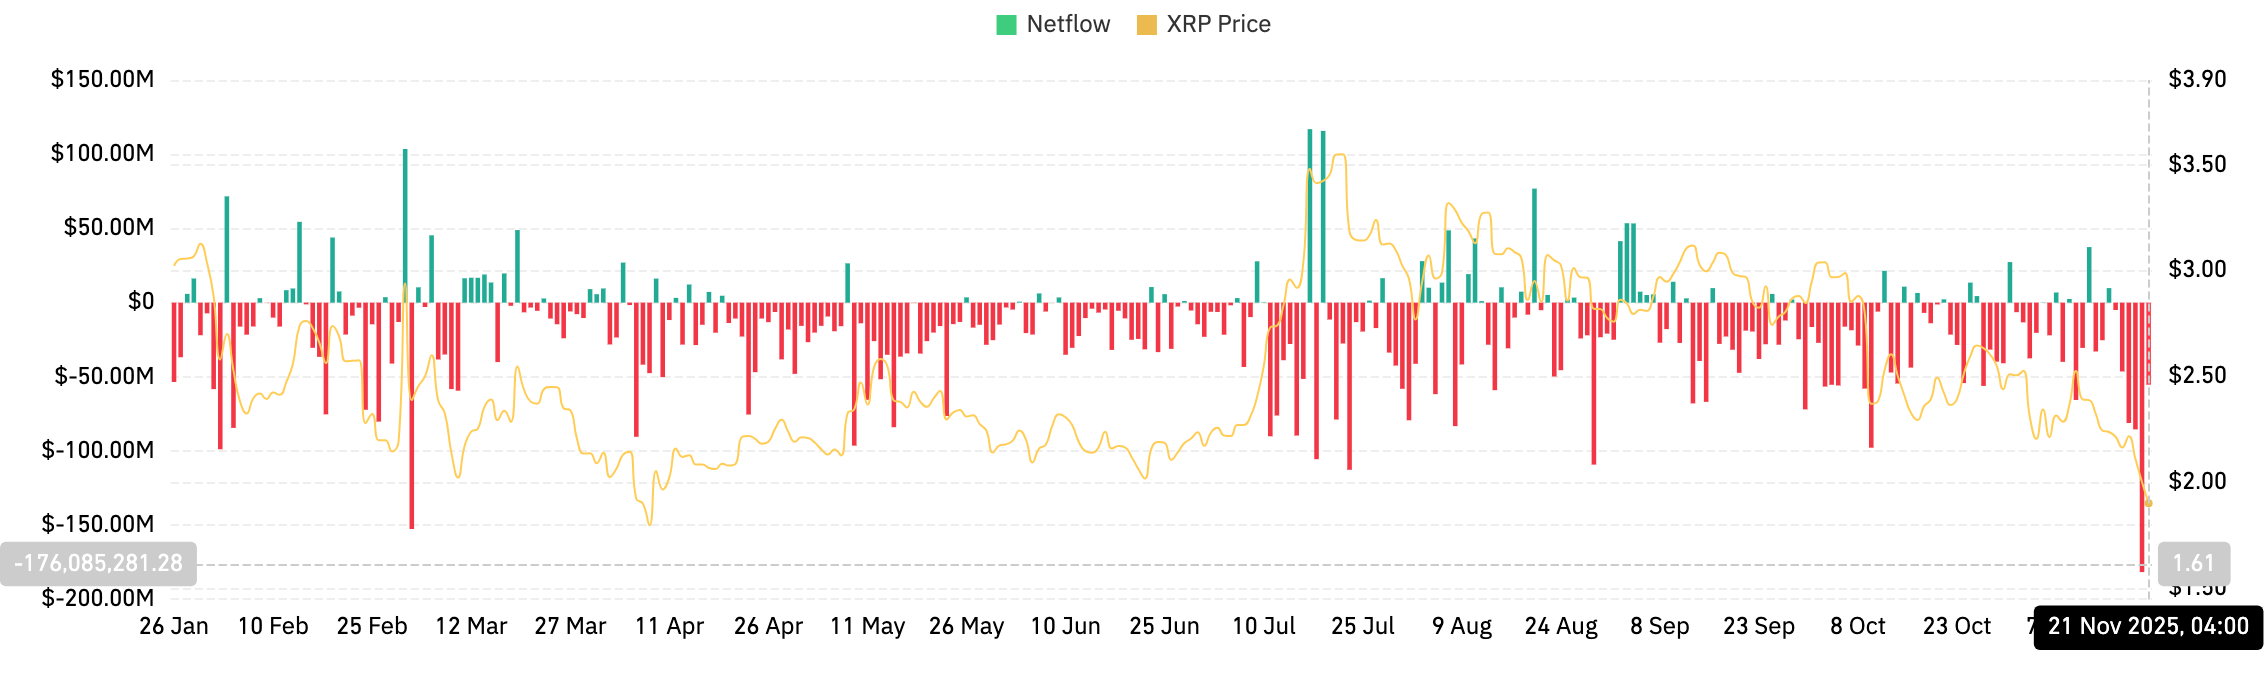 XRP Netflows (Source: Coinglass)
Coinglass data shows $54.7 million in net outflows on November 21, one of XRP’s largest single-session red prints in months. The steady drip of outflows since early November has escalated into heavier distribution, confirming that market participants are reducing exposure as volatility increases.
The magnitude of this latest outflow mirrors the early-year flushes that preceded major trend shifts. Price tends to follow when red flows cluster near local lows, and the current breakdown aligns with that pattern.
Related: Ethereum Price Prediction: ETH Under Pressure as Market Indicators Flash Persistent Weakness
The absence of meaningful green inflow days over the past three weeks shows that liquidity continues to leave exchanges, tightening conditions for a rebound.
Descending Trendline Rejection Reinforces Bearish Structure
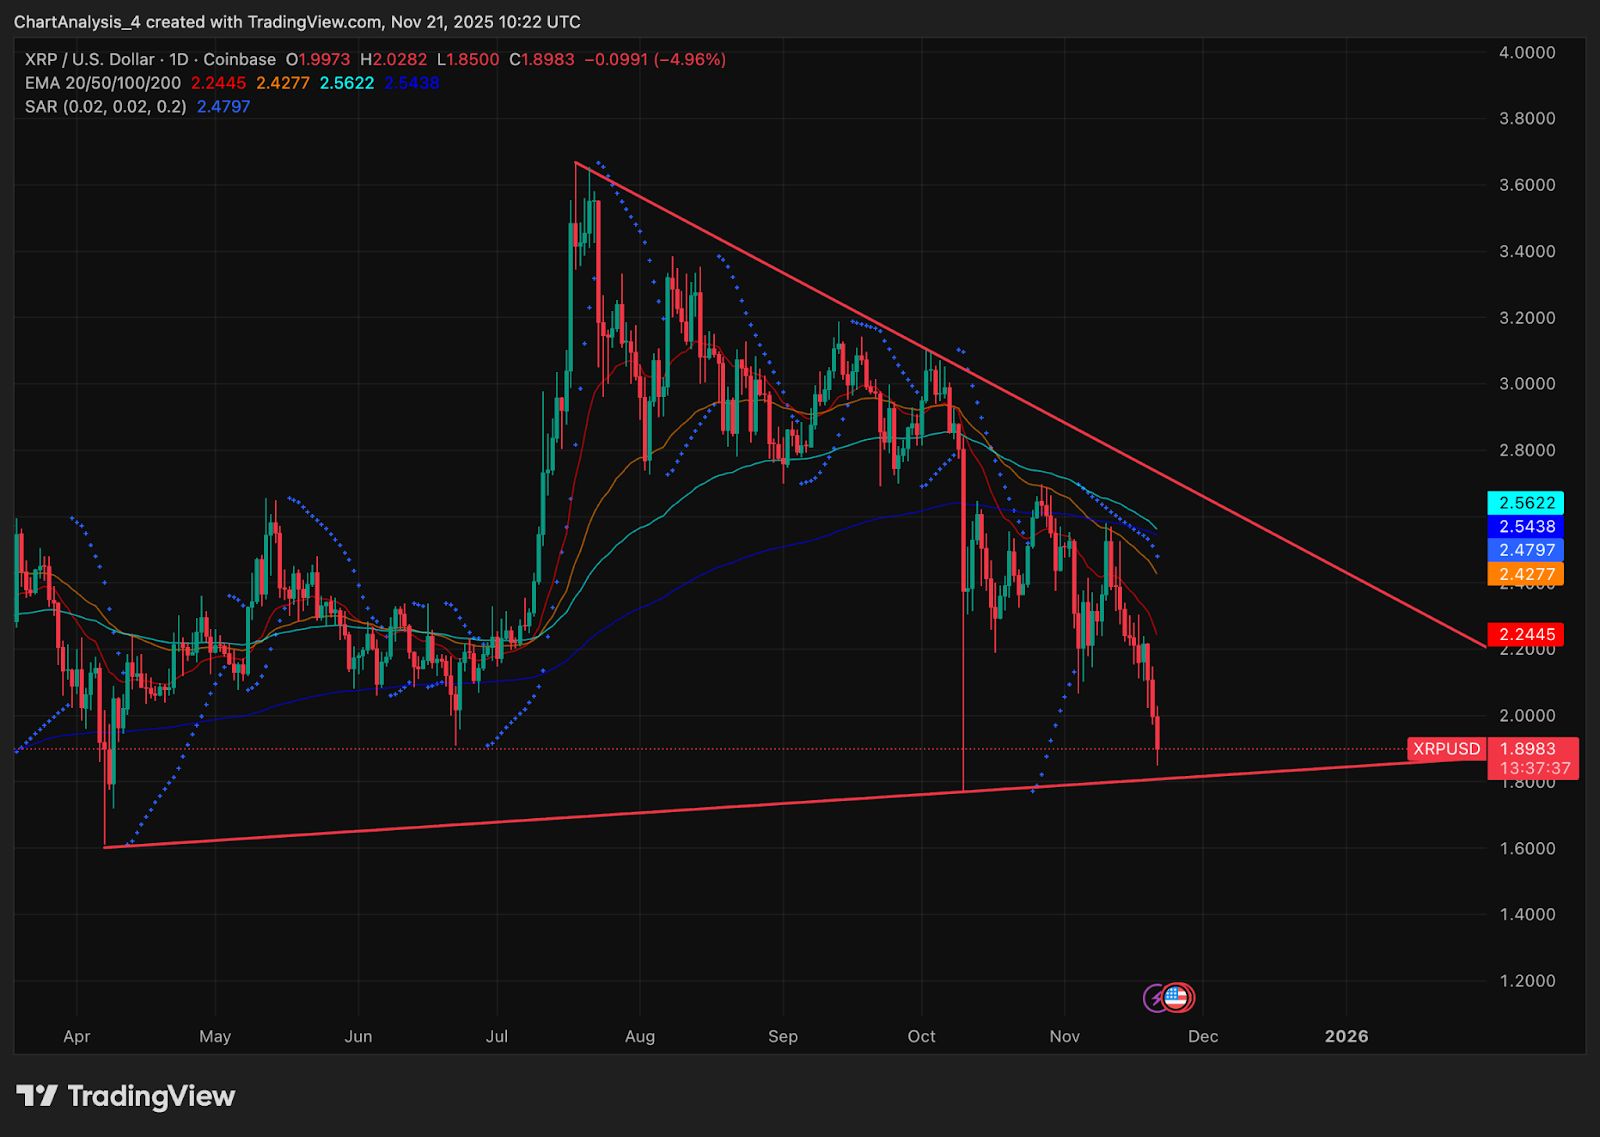 XRP Price Dynamics (Source: TradingView)
The daily chart highlights a decisive rejection from the long-term descending trendline that has capped every major rally since September. XRP attempted to break above the cluster of EMAs earlier this month, but the move stalled and rolled over as sellers defended the trendline near $2.55.
With the rejection confirmed, XRP has moved into a lower-low sequence for the first time since mid-year. Price now trades below the 20, 50, 100, and 200-day EMAs, each sloping downward and forming a strong ceiling. The 200-day EMA near $2.56 is now the dominant resistance level.
The breakdown also pushes price toward the long-term ascending support that originates in April. XRP is hovering just above that trendline. Losing this line would mark a major structural shift into deeper territory.
EMAs Flip Into Resistance As Sellers Maintain Control
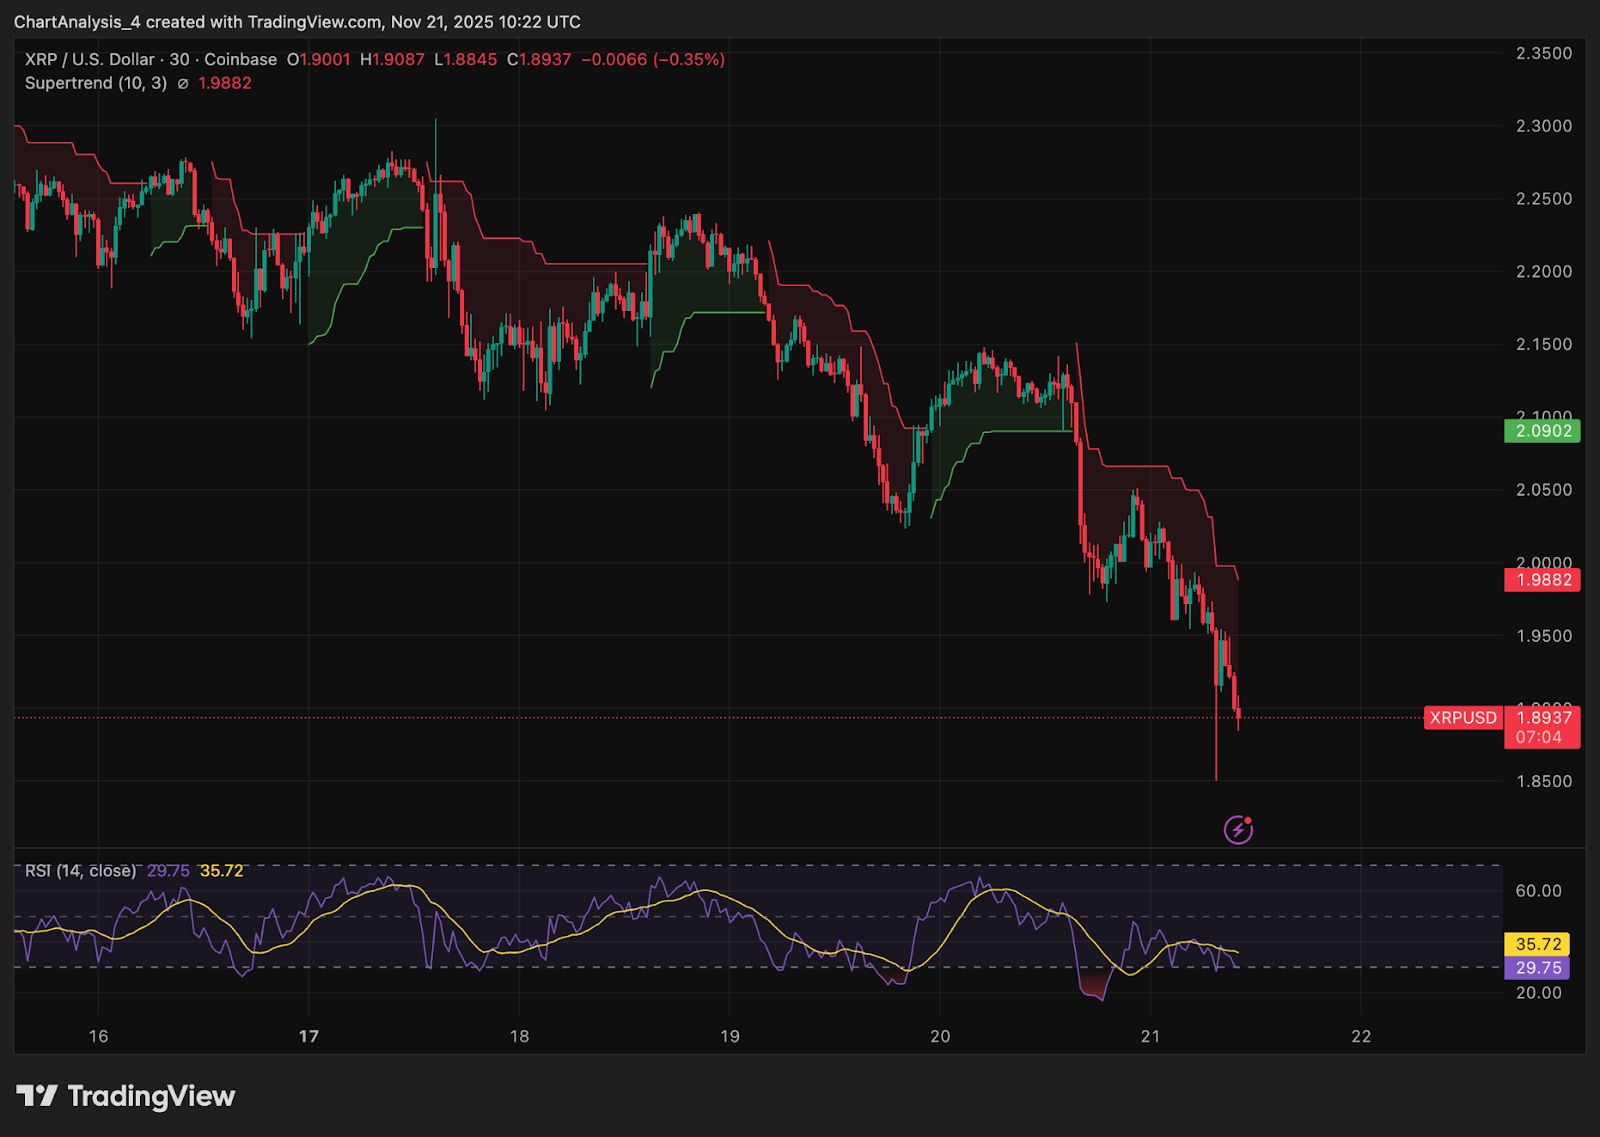
The short-term chart reinforces the larger trend. On the 30-minute timeframe, XRP trades under the Supertrend line at $1.99. Every attempt to reclaim the band has been rejected quickly, showing clear intraday control by sellers.
Related: Cardano Price Prediction: Weekly Breakdown Exposes Deeper Risk
The EMA stack on higher timeframes adds to the bearish weight. The 20-day EMA at $2.24, the 50-day EMA near $2.42, and the 100-day EMA at $2.54 now form a staircase of resistance. Buyers would need to clear this entire cluster to reverse momentum.
Until that happens, each bounce sits within a corrective structure rather than a trend shift.
Momentum Indicators Show Pressure Without Full Capitulation
 XRP Price Dynamics (Source: TradingView)
RSI on the daily chart sits near 30, signaling heavy downside pressure but not a confirmed momentum washout. XRP has historically shown stronger rebounds only when RSI dips further into oversold zones with improving flow.
On shorter intervals, RSI attempts to stabilize near 35, but no follow-through has emerged. The lack of rising volume confirms that buyers are not stepping in aggressively despite stretched conditions.
Parabolic SAR dots remain firmly above price, confirming that trend direction still points lower. Momentum does not yet show any constructive divergence.
Outlook. Will XRP Go Up?
The bullish case requires XRP to defend $1.85 and reclaim $1.99 with improving flows. A daily close back above $2.24 would signal that buyers can challenge the EMA cluster and attempt to retake the descending trendline. If that move holds, $2.55 becomes the major upside target.
The bearish case activates if XRP loses $1.85. A close below this line confirms a trend breakdown and exposes the next support range between $1.72 and $1.65. Failure to hold that zone accelerates downside momentum into December.
Related: Tensor Price Prediction: TNSR Breakout Sparks New Interest After Months of Decline
If XRP reclaims $1.99 and breaks through $2.24, early recovery begins. Losing $1.85 shifts the structure into a deeper corrective phase with sellers in full control.