
The "powder keg" of U.S. Treasury bonds ignites, gold surges to a decisive battle at the 5110 high!

FX678 News, January 27—— On Tuesday (January 27), the global financial markets presented a complex and intertwined situation. Driven by the US Treasury yield curve trend, geopolitical uncertainties, and expectations of fiscal policies in major economies, the logical chain among three core assets—US dollar, US Treasuries, and gold—is undergoing profound evolution.
On Tuesday (January 27), the global financial markets presented a complex and intertwined situation. Driven by the US Treasury yield curve trend, geopolitical uncertainties, and expectations of fiscal policies in major economies, the logical chain among three core assets—US dollar, US Treasuries, and gold—is undergoing profound evolution.
US Treasury Yield Curve “Steepening”: Core Driver in Dollar’s Volatile Pattern
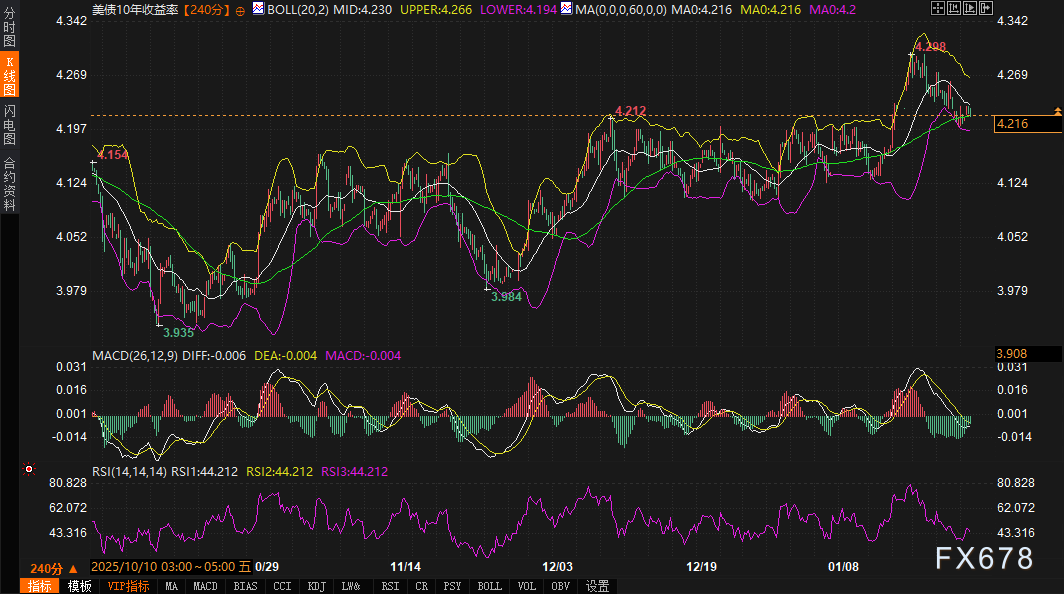
Current changes in the US Treasury market are a key window for observing the dollar’s movements. According to the latest 240-minute candlestick chart, the 10-year US Treasury yield has recently shown an upward trend within a wide range of 3.984% to 4.298%, with the latest quote remaining near 4.212%.
The overseas fixed income market overnight exhibited obvious “slipping and steepening” features. This steepening mainly stems from concerns about medium- and long-term fiscal deficits and the looming pressure of Treasury auctions. Major institutions noted that global fixed income products generally weakened, especially as US Treasury trading volumes remained light in the early morning, hinting that the market is in a wait-and-see mode ahead of key macroeconomic events.
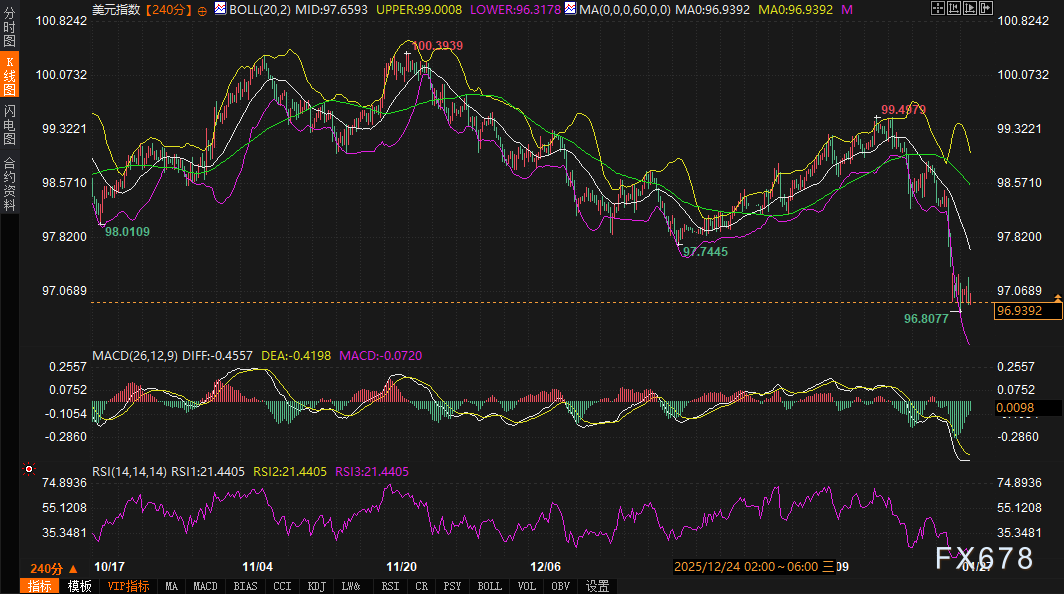
The US Dollar Index (DXY) is currently at 96.9370, standing at a key technical crossroads. Despite US Treasury yields remaining at a relatively high level above 4.2%, the dollar has not shown a proportional strength. The 240-minute chart shows that the Dollar Index is approaching the lower Bollinger Band (96.3175) and the MA(60) support level.
Momentum Analysis: While the MACD indicator’s DIFF and DEA are negative, they are showing a convergence trend, and the green bars are continuously shortening, indicating that bearish momentum is fading.
Oversold Signal: The RSI three lines are stably around 21.3256, indicating a significant oversold zone.
Analytical Conclusion: The resilience of US Treasury yields should theoretically support the dollar, but due to recent market pricing of global liquidity and the rebound of other non-US currencies (such as the yen and pound), the US dollar is experiencing a divergent decline. In the next 2-3 days, if US Treasury yields continue to rise due to fiscal concerns or weak demand in Treasury auctions, it may trigger a technical rebound for the US dollar from the oversold zone.
Transmission of Safe-Haven Effect: How Bond Market Volatility Drives Gold Premium
Unlike the conventional logic of a negative correlation where “rising yields suppress gold prices,” current gold trends show remarkable resilience, mainly because the “safe-haven attribute” transmitted from the bond market has outweighed the consideration of “holding costs.”
Not only is the US Treasury market under pressure, but global bond markets are also experiencing simultaneous fluctuations. Taking Japanese Government Bonds (JGB) as an example, due to fiscal concerns and caution ahead of the upcoming 40-year JGB auction, yields have risen across the board, with the 10-year JGB yield reaching a high of 2.28%. Analysts from major institutions note that the sharp volatility of Japan’s yield curve reflects market concerns about the balance between overly loose policies and fiscal risks.
This anxiety in global bond markets is transmitted to spot gold through the logic of credit risk and declining purchasing power. When the attractiveness of fixed income products decreases (as their real value is eroded by inflation or deficits), investors tend to regard gold as the “last line of defense” for risk aversion.
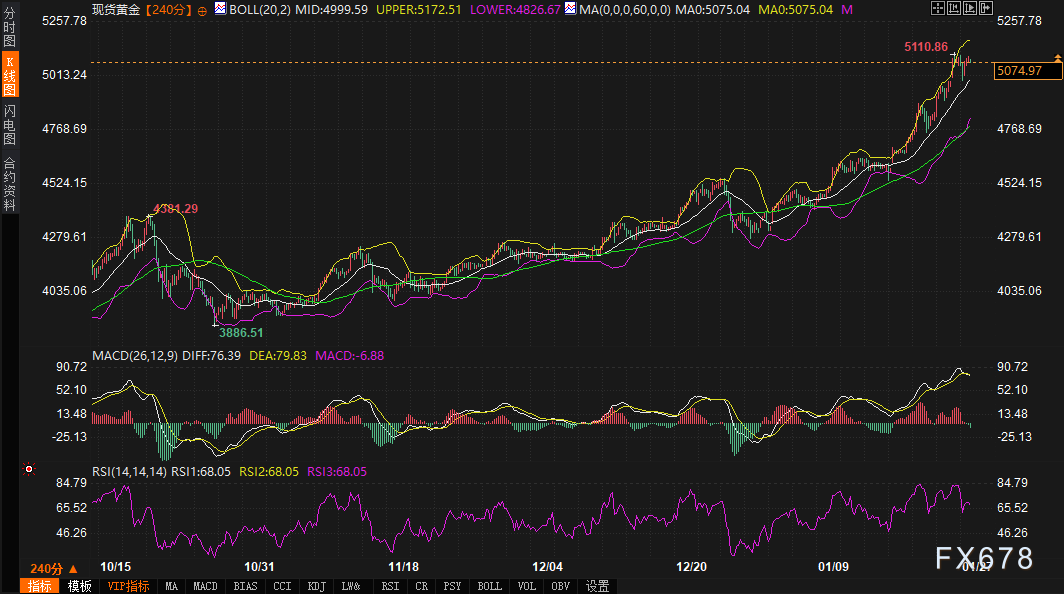
Spot gold (XAU/USD) currently displays a clear upward channel on the 240-minute chart, with the latest price fluctuating between $5,074.75 and $5,089.80, extremely close to the historical high of $5,110.86 set on Monday.
Indicator Resonance: The middle Bollinger band continues to rise, and the price remains steadily between the middle and upper bands, showing a strong bullish pattern.
Bulls in Control: Although the MACD histogram is still in negative territory, it has narrowed significantly, the RSI is in the strong zone at 68.00, and has not yet entered extreme overbought territory, indicating that there is still upward space.
Major institutions (such as Deutsche Bank and Société Générale) have recently raised their gold price forecasts to $6,000/oz, believing that investors are systematically increasing their allocation of non-dollar and physical assets. In addition, Trump’s “tariff rhetoric” and concerns involving Iran and the Russia-Ukraine situation have further locked in safe-haven buying for gold.
2-3 Day Outlook and Key Support/Resistance Ranges
Combining fundamentals and technicals, the market will enter a high volatility period in the next 2-3 days, with a focus on the upcoming Federal Reserve (Fed) policy meeting. While markets generally expect interest rates to remain unchanged, the forward guidance on monetary policy will directly determine the secondary pricing of the bond market.
Range Logic: Although the US dollar has a demand for oversold rebound, safe-haven demand provides a solid bottom for gold prices. If the previous high of $5,110 is breached, the market will enter a new price vacuum area.
Support and Resistance Forecast:
Key resistance above: $5,110.86 (previous record high), $5,125 (short-term swing expansion).
Key support below: $5,050.00 (psychological level), $5,020.00 (Bollinger middle band support).
Intraday focus: Observe whether a low-level golden cross is formed on the 240-minute MACD, and whether sudden geopolitical news instantly triggers safe-haven sentiment.
Range Logic: Given that RSI is at an extremely low level of around 21, the dollar has a strong demand for recovery, and the steepening of US Treasury yields provides some bottom support.
Support and Resistance Forecast:
Key resistance above: 97.4500 (MA60 level), 97.8000.
Key support below: 96.3175 (lower Bollinger band), 96.0000 (whole number level).
Intraday focus: Watch whether the 10-year US Treasury yield can remain above 4.25%. If yields continue to rise due to fiscal concerns, the dollar’s decline will halt.
Support and Resistance Forecast:
Key resistance above: 4.298% (recent high), 4.35%.
Key support below: 4.10% (Bollinger middle band), 3.984%.
In the next 48 to 72 hours, the main theme of the market is "bond market pricing leads, safe-haven sentiment maintains."
The US Dollar Index seeks balance amid the contradiction between technical oversold status and high bond yields, and is likely to see a corrective rebound after bottom consolidation in the short term. However, the strength of this rebound is limited by global investors’ doubts about the US fiscal outlook.
As for gold, the “credit risk aversion” brought by bond market volatility has become its endogenous driving force for gains. As long as the steepening of the US Treasury yield curve is based on concerns over fiscal risks or tariff rhetoric triggering inflation worries, the “co-rising” pattern of gold and yields could continue. Investors should pay close attention to Wednesday and Thursday’s Treasury auction results; if weak demand leads to another yield spike, deeper safe-haven volatility could be triggered in the market.
Disclaimer: The content of this article solely reflects the author's opinion and does not represent the platform in any capacity. This article is not intended to serve as a reference for making investment decisions.
You may also like
Microsoft Q2 Earnings Preview: AI Execution Shapes Tech Sector Outlook
Bitcoin Rainbow Chart says ‘accumulate’ – But analysts warn of bear market
ASML Q4 bookings beat expectations as chipmakers order more to satisfy AI demand
Nillion 2.0 Goes Live on Ethereum, Ushering in Community-Run Privacy Computing