
Chainlink price today trades near $10.83 after breaking below the two month consolidation range that held between $12 and $15. The drop comes despite positive fundamental developments including fresh ETF inflows and a strategic partnership with Turtle protocol announced earlier this week.
On Wednesday, Turtle announced a strategic partnership with Chainlink to bring institutional liquidity onchain. The deal makes Chainlink CCIP and Data Feeds a requirement for Turtle’s liquidity infrastructure, positioning LINK as core infrastructure for cross chain capital markets.
Turtle connects over 410,000 wallets and hundreds of institutional liquidity providers across multiple ecosystems. The partnership strengthens Chainlink’s role in pricing, risk assessment, and cross chain rebalancing for institutional dealflow.
Michael Mendes, Head of DeFi at Chainlink Labs, called the partnership a major step toward defining how liquidity moves across onchain capital markets. Yet despite the bullish fundamental backdrop, price action has moved sharply in the opposite direction.
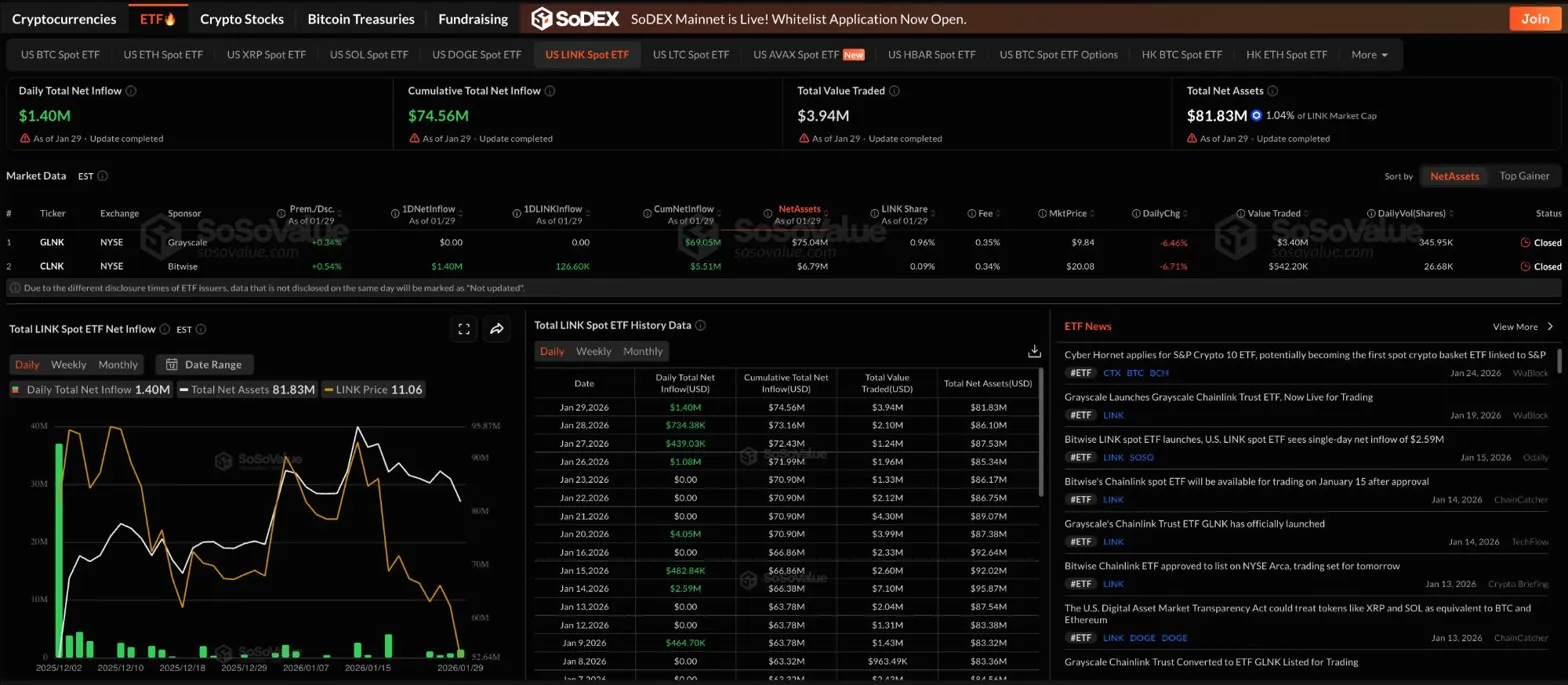 LINK Spot ETF Data (Source: SoSoValue)
Chainlink ETFs recorded $1.4 million in net inflows on January 29, bringing cumulative inflows to $74.56 million with total net assets at $81.83 million. The Grayscale and Bitwise LINK funds continue to attract institutional capital even as spot price declines.
Moreover, LINK ETFs have outperformed DOGE funds significantly, with nearly ten times the assets under management, indicating that institutional conviction in Chainlink’s utility thesis remains stronger than meme coin speculation.
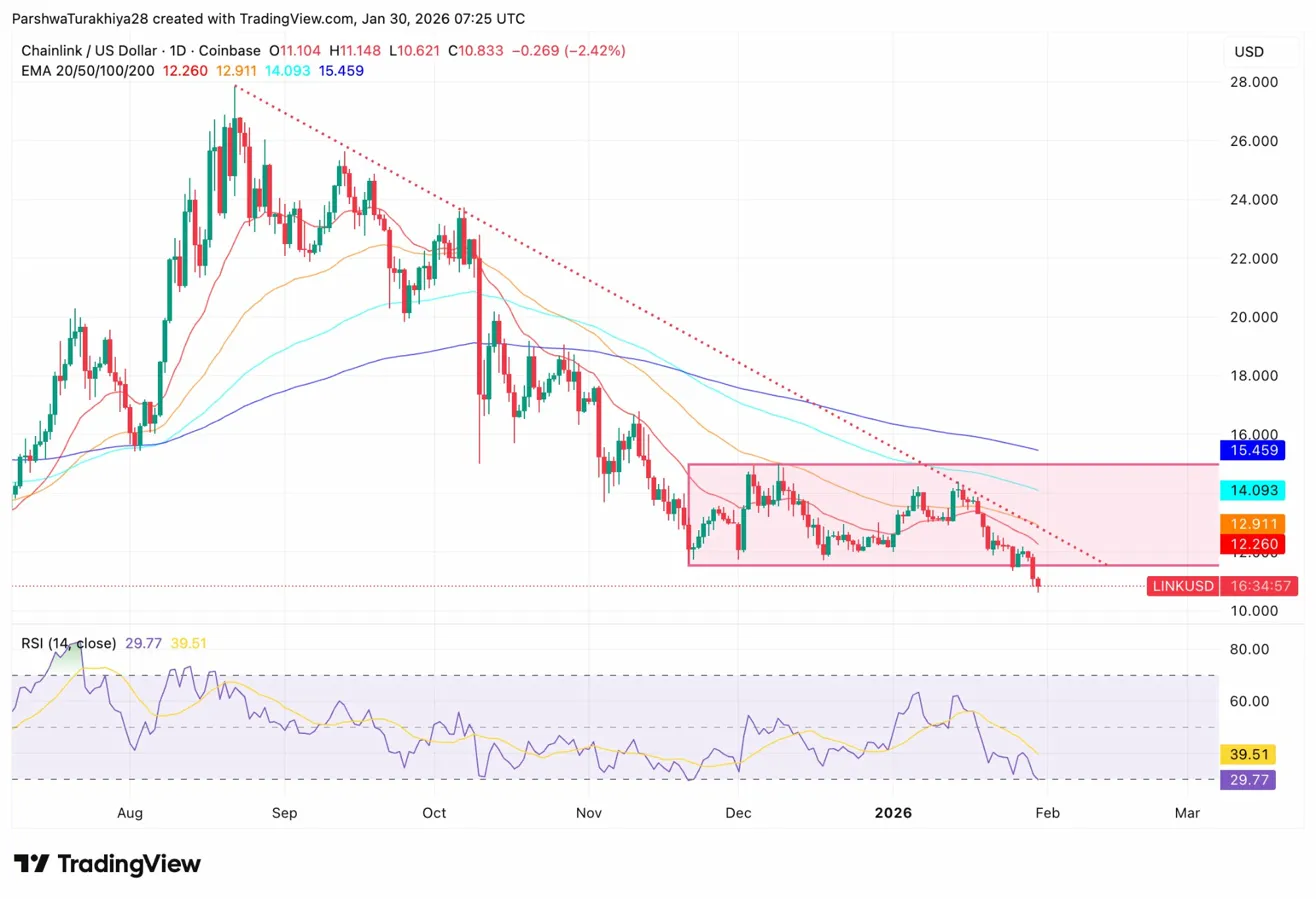 LINK Price Dynamics (Source: TradingView)
On the daily chart, LINK trades below all four major EMAs with a bearish structure confirmed. The 20 day EMA sits at $12.26, the 50 day at $12.91, the 100 day at $14.09, and the 200 day at $15.45. That stacked resistance creates a ceiling that buyers must reclaim to shift momentum.
The December to January consolidation range between $12 and $15 has now broken to the downside. Price failed multiple times at the $15 resistance zone before rolling over, and the loss of $12 support confirms sellers have taken control.
Related: Dogecoin Price Prediction: DOGE Breaks $0.12 As ETF Flows Dry Up
RSI sits at 29.77, entering oversold territory for the first time since the November correction. While oversold readings can precede bounces, they do not guarantee reversals without supporting price action.
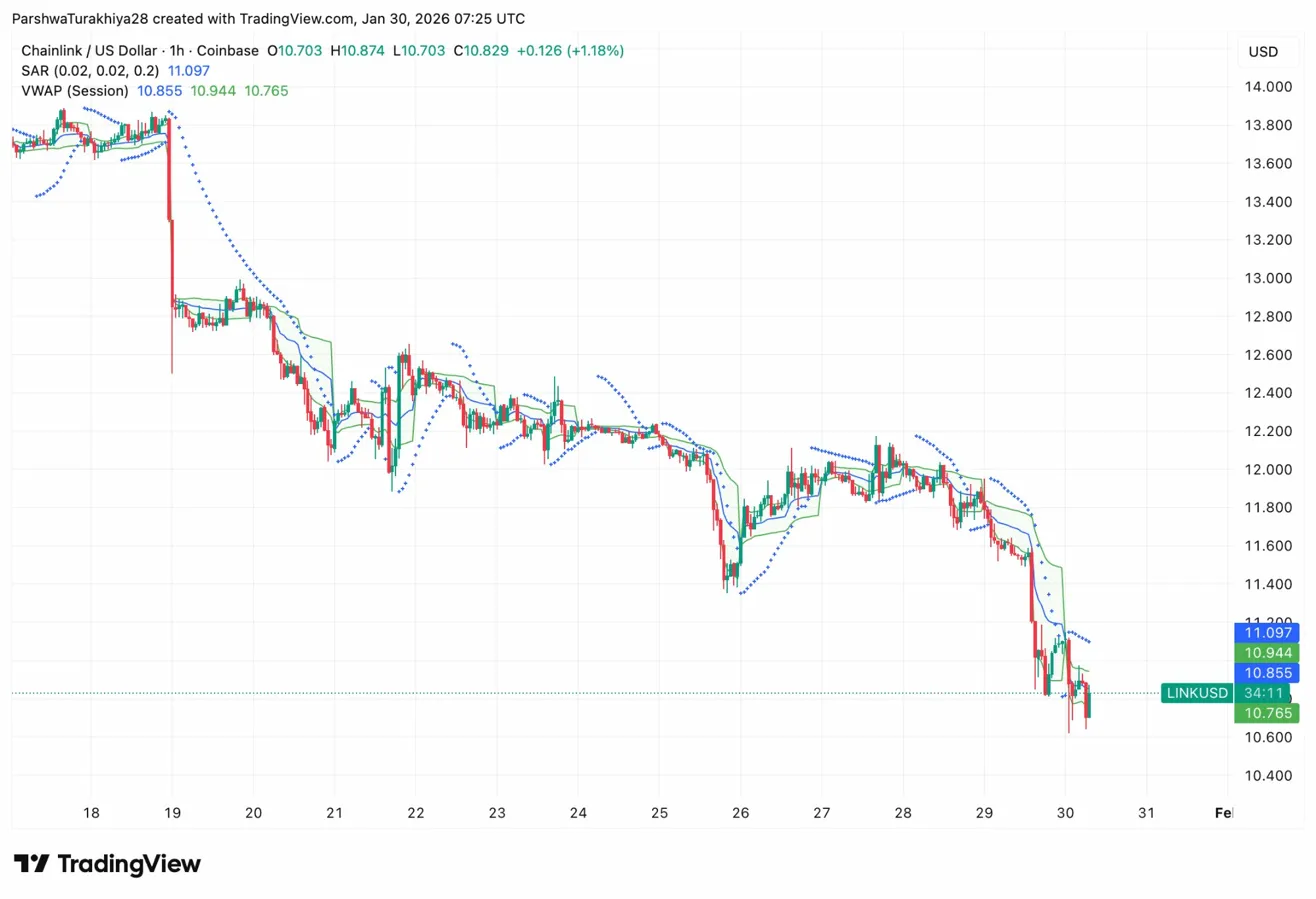 LINK Price Action (Source: TradingView)
On the hourly chart, LINK shows a clear downtrend from the January 18 high near $14. The Parabolic SAR remains bearish at $11.09, while price trades below session VWAP at $10.85.
The lower VWAP band at $10.76 marks immediate support. Price briefly wicked to $10.62 during the session low before recovering, suggesting some buying interest near the $10.60 level.
The steady decline from $14 to $10.80 over twelve days reflects sustained selling pressure rather than a single liquidation event. Each bounce attempt has been sold into, with lower highs forming consistently across the hourly timeframe.
The trend remains bearish while price trades below the EMA cluster, but oversold RSI and positive ETF flows suggest a relief bounce could emerge.
- Bullish case: A daily close above $12.26 would reclaim the 20 day EMA and signal stabilization. That move would require a shift in broader altcoin sentiment and could target the $12.90 to $14 resistance zone.
- Bearish case: A close below $10.60 would confirm continuation of the breakdown and expose the $9 demand zone from October 2024. Without improving spot flows, that scenario remains probable.