
Howmet (HWM) Reports Q4 Earnings: What Key Metrics Have to Say

For the quarter ended December 2025, Howmet (HWM) reported revenue of $2.17 billion, up 14.7% over the same period last year. EPS came in at $1.05, compared to $0.74 in the year-ago quarter.
The reported revenue represents a surprise of +1.26% over the Zacks Consensus Estimate of $2.14 billion. With the consensus EPS estimate being $0.97, the EPS surprise was +8.66%.
While investors scrutinize revenue and earnings changes year-over-year and how they compare with Wall Street expectations to determine their next move, some key metrics always offer a more accurate picture of a company's financial health.
As these metrics influence top- and bottom-line performance, comparing them to the year-ago numbers and what analysts estimated helps investors project a stock's price performance more accurately.
Here is how Howmet performed in the just reported quarter in terms of the metrics most widely monitored and projected by Wall Street analysts:- Total Sales- Engine Products: $1.16 billion versus $1.13 billion estimated by three analysts on average. Compared to the year-ago quarter, this number represents a +19.5% change.
- Total Sales- Fastening Systems: $454 million versus the three-analyst average estimate of $462.51 million. The reported number represents a year-over-year change of +12.9%.
- Total Sales- Engineered Structures: $287 million versus $310.13 million estimated by three analysts on average. Compared to the year-ago quarter, this number represents a +3.2% change.
- Total Sales- Forged Wheels: $264 million versus $226.24 million estimated by three analysts on average. Compared to the year-ago quarter, this number represents a +8.6% change.
- End Market Revenue- Aerospace- Commercial: $1.14 billion compared to the $1.14 billion average estimate based on two analysts. The reported number represents a change of +13.5% year over year.
- End Market Revenue- Aerospace- Defense: $367 million versus the two-analyst average estimate of $364.62 million. The reported number represents a year-over-year change of +20.3%.
- End Market Revenue- Commercial Transportation: $310 million versus the two-analyst average estimate of $278.53 million. The reported number represents a year-over-year change of +4%.
- Adjusted EBITDA- Engine Products: $396 million versus the three-analyst average estimate of $378.39 million.
- Adjusted EBITDA- Forged Wheels: $79 million compared to the $65 million average estimate based on three analysts.
- Adjusted EBITDA- Engineered Structures: $63 million versus the three-analyst average estimate of $63.99 million.
- Adjusted EBITDA- Fastening Systems: $139 million compared to the $142.96 million average estimate based on three analysts.
Disclaimer: The content of this article solely reflects the author's opinion and does not represent the platform in any capacity. This article is not intended to serve as a reference for making investment decisions.
You may also like
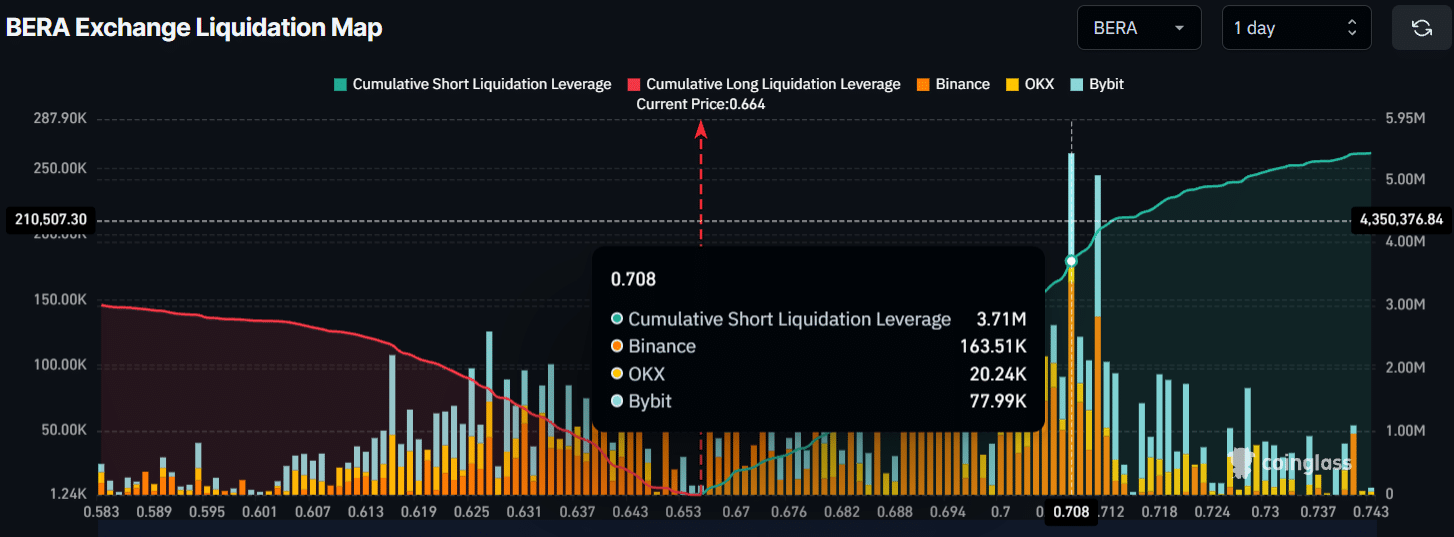
Berachain (BERA) could fall by another 45% IF these conditions are met!
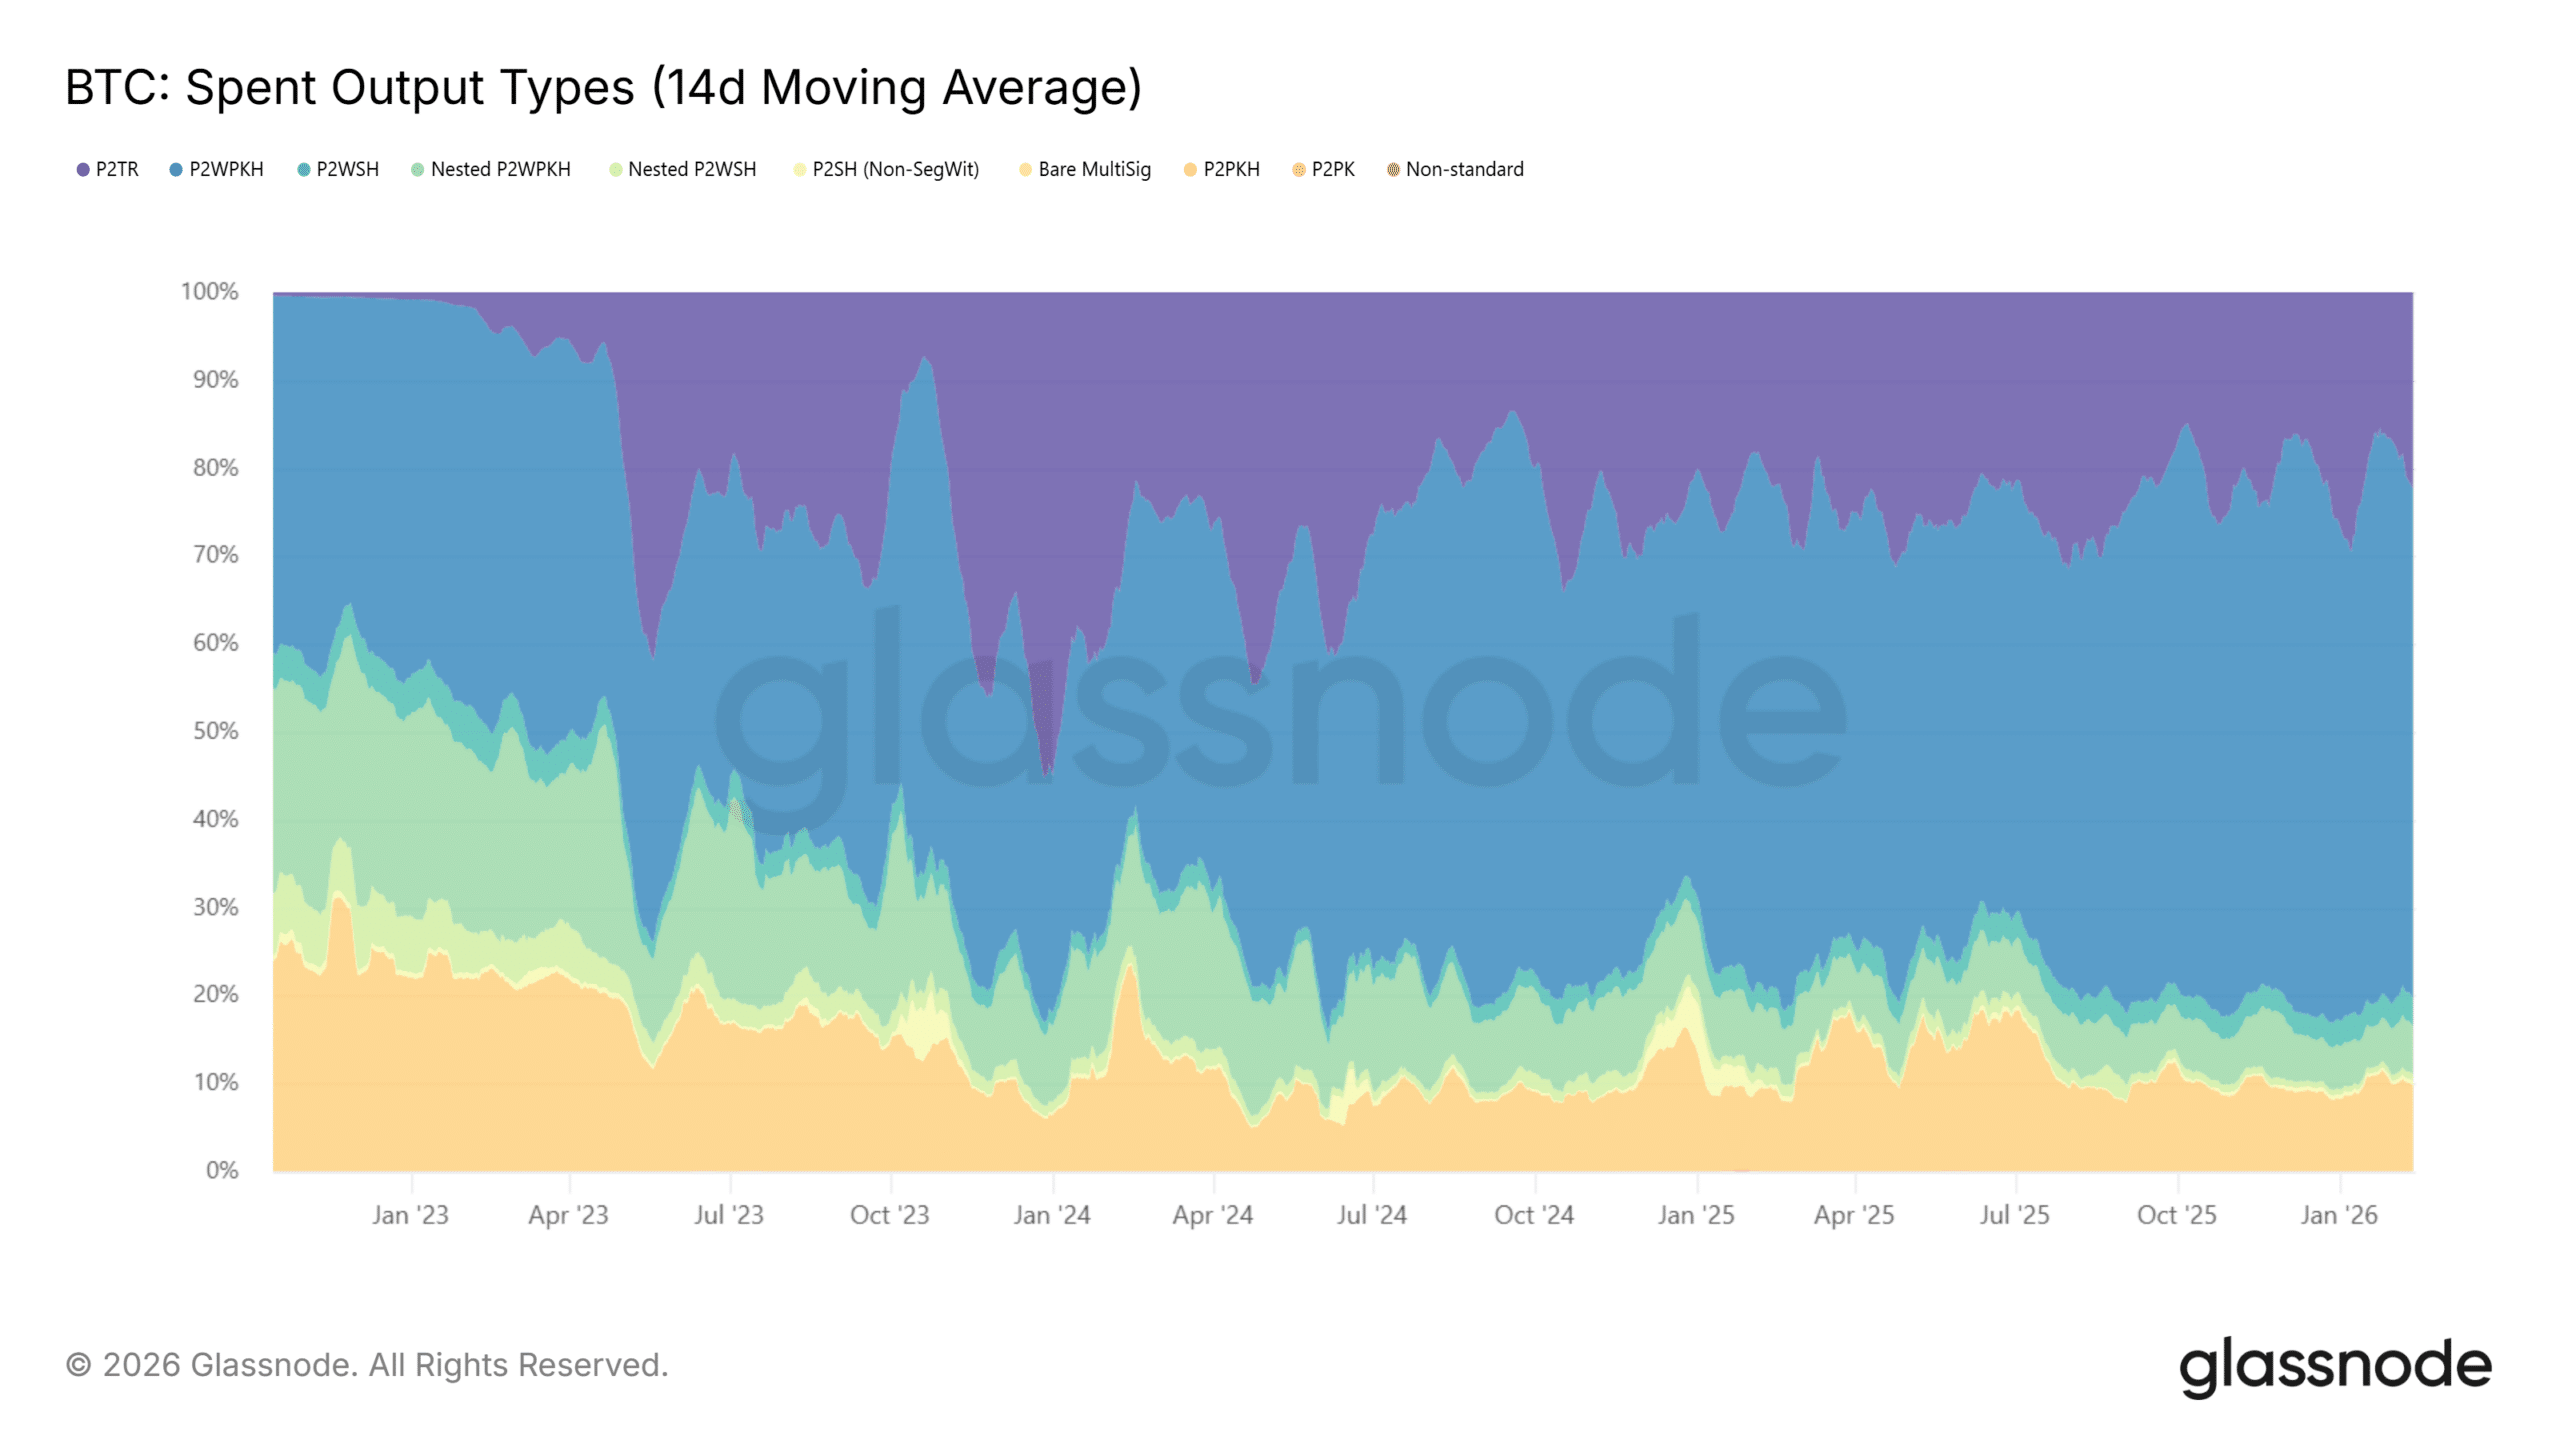
Bitcoin’s post-quantum plan BIP-360 gains traction, but will it reverse market sell-off?
Fastly (FSLY) Climbs to 2-Year High on Earnings Blowout, Double-Digit Growth Targets

Armlogi Holding Corp. Announces Second Quarter and First Half of Fiscal Year 2026 Results
