
Quantum Outlook for March 2026: 3 Stocks With Over 100% Price Target

The quantum computing sector has recorded lackluster performance in February 2026. Month to date, the Defiance Quantum ETF QTUM has edged up 1.2% with many pure-plays showing volatility and sector-wide weakness as investors rotated away from high-risk, long-duration tech assets.
Amid geopolitical tensions and policy uncertainty, many investors chose to sell their quantum stocks to lock in gains, putting downward pressure on prices.
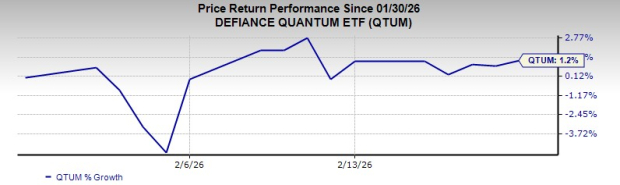
Image Source: Zacks Investment Research
Macroeconomic Backdrop
Monetary policy in major economies remains in pause mode. The Federal Reserve held its benchmark interest rate steady in late January 2026, keeping the federal funds rate at about 3.50–3.75%.
Other central banks are also maintaining elevated rates to control inflation while monitoring labor market stabilization. Fed minutes show job gains and unemployment stabilization, but inflation is still above target, restraining aggressive rate easing.
Further, heightened geopolitical tensions, such as in the Middle East and trade frictions involving North America, continue to elevate market uncertainty, potentially delaying capex in deep tech sectors. Additionally, global trade frictions add supply chain risk for hardware-intensive quantum ecosystems, dragging down sentiment.
As per major market watchers, stable job growth with unemployment near pre-pandemic levels supports consumer confidence but does not meaningfully shift risk appetite toward speculative equities like quantum stocks.
Market and Industry Fundamentals
Going by an Investing.com article, the global quantum computing market will reach about $2 billion in 2026, driven by defense, aerospace and early enterprise use cases, but the sector remains nascent with low current revenues.
Leading quantum computing companies, such as IonQ IONQ, D-Wave Quantum QBTS and Rigetti Computing RGTI, all Zacks Rank #3 (Hold) stocks, currently show significant upside in their short-term price targets.
You can see the complete list of today's Zacks Rank #1 (Strong Buy) stocks here
As the charts show, IONQ’s average price target represents an increase of 125.85% from the last closing price of $33.43.

Image Source: Zacks Investment Research
QBTS’s average price target represents an increase of 108.26% from the last closing price of $19.38.

Image Source: Zacks Investment Research
RGTI’s average price target represents an increase of 142.77% from the last closing price of $16.60.

Image Source: Zacks Investment Research
March 2026 Outlook
These projections above are largely based on expectations that the companies will achieve key technological milestones, expand enterprise partnerships and accelerate commercialization of their quantum systems.
However, this bullish outlook is tempered by significant stock price volatility. Investors remain cautious because these firms are still in early revenue stages and profitability timelines are uncertain. As a result, valuations can swing sharply depending on fourth-quarter earnings updates (to be released shortly), contract wins, or broader market sentiment toward high-risk technology stocks.
Overall, given the data and estimates, March is likely to see selective stabilization rather than broad sector recovery. Stocks tied to defense contracts, hardware milestones or near-term revenues could outperform, while others could remain valuation-sensitive to macro risk and execution progress.
Disclaimer: The content of this article solely reflects the author's opinion and does not represent the platform in any capacity. This article is not intended to serve as a reference for making investment decisions.
You may also like
JPMorgan Brings JPM Coin to Ethereum for Institutions

How Ethereum Could Stay Secure Even If Today’s Online Locks Stop Working

Cardano Price Prediction: Can ADA Defend $0.22 as Hoskinson Builds a New Programming Language?
 VIPAI Asset Sell-Off and Selective Rotation in Crypto
1. Technology stocks fell sharply as investor interest shifted toward energy and selected defensive assets. From October 10 to 16, the Nasdaq 100 declined 5.49% and the S&P 500 fell 1.95%, while the Dow gained 0.67% and WTI crude rose 10.41%. BTC, ETH, and SOL declined 1.27%, 2.65%, and 4.44%, respectively. This week's technology earnings will be an important test of whether revenue growth, margins, and cash flow can justify current valuations. Better-than-expected results could help stabilize markets in the near term. 2. Crypto continues to see pockets of strong activity, but a broad-based altcoin season has yet to materialize. CoinMarketCap's (CMC) Altcoin Season Index stood at 54 as of the October 18 UTC daily observation, below the altcoin-season threshold of 75, while BTC dominance rose to 60.08%. Our proxy leverage ratio fluctuated between 4.00 and 4.07 during the week, showing no sustained increase and suggesting limited appetite for additional leverage. Meanwhile, as major exchanges expand access to traditional financial assets, the recent sell-off in AI-related equities could attract short-term speculative capital away from crypto. Such capital rotation could make it more difficult for a new altcoin season to take hold. 3. Papertrade's loss-to-mine model has generated significant interest across the crypto community. The protocol combines high-leverage derivatives trading with zero slippage and a mechanism that rewards trading losses with PAPER tokens. Across the eight complete UTC days from October 10 to 17, cumulative reported revenue reached approximately $56.08 million, including $51.90 million distributed to token holders. With growing participation from key opinion leaders (KOLs), Papertrade has reportedly ranked among the top three platforms by profitability in the broader market recently. Assets to watch: BTC, ETH, SOL, ARB, OP, SKHYNIX, SKHY, META, TSLA, LRCX, and SPCX. Key research priorities this week: Cash flow performance in technology earnings; the relative discount and holding costs of the two SK Hynix contracts; and U.S. initial jobless claims and PMI data. Weekly market data cover the period through October 16, while research information was verified through October 18. Observation periods are specified separately for each chart.

Crypto prices
More


