
Intuit's Sharp Intraday Downturn: What's Behind the 4.58% Slide?

Summary
• IntuitINTU-4.82% (INTU) tumbles 4.58% in early afternoon trading, with price falling from $451.37 to $436.11.
• The stock is currently bouncing between the intraday low of $432.48 and high of $452.85.
• Leveraged ETFs like INTW and LINT are also down, showing the sector remains under pressure.
Intuit faces a significant intraday correction as traders react to shifting market conditions. With the stock trading well below its 200-day average and key technical indicators flashing caution, the question now is whether this is a short-term selloff or the beginning of a larger bearish shift. The options chain is already showing heavy activity, especially near the $435–440 range, hinting at positioning for a potential bounce or further downside.


Technical Divergence and Positioning Trigger Sharp Decline
The sharp selloff in Intuit reflects a combination of bearish technical signals and increased put-call positioning. The stock is currently trading below its 200-day moving average of 639.84, indicating a clear breakdown in long-term sentiment. While the RSI of 58.41 suggests the stock is not yet overbought, the MACD line remains well above the signal line, which may indicate a potential divergence forming between price and momentum. Additionally, the options data shows heavy volume in out-of-the-money put options and near-the-money calls, suggesting that traders are hedging downside risk while still maintaining some bullish exposure.
Software Sector Under Broader Pressure as Microsoft Drives Mixed Performance
The broader software sector is under pressure, with Microsoft (MSFT) down 2.34% intraday. As the sector leader, Microsoft's underperformance could signal a potential shift in investor sentiment for high-growth tech names. Intuit's sharp correction aligns with this broader trend, although it remains more pronounced than the sector average. The leveraged ETFs INTW and LINT, which track Intuit-specific exposure, are down 1.30% and 2.17%, respectively, suggesting continued bearish pressure on the stock.
Strategic Positioning for Near-Term Volatility: ETFs and Options Analysis
• 200-day MA: 639.84 (well below)
• 30-day MA: 423.32 (below current price)
• RSI: 58.41 (neutral to bearish)
• MACD: 0.43 (bullish but diverging)
• Bollinger Band: 437.66 (middle band near price)
• Support/Resistance (30D): 397.89–400.34 (support), 654.84–663.81 (resistance)
Intuit is trading near critical technical levels with its price hovering close to the middle Bollinger Band of 437.66. Given the high volume of options activity and strong implied volatility (IV), traders should consider strategies that benefit from volatility while avoiding overexposure to further downside. Leveraged ETFs such as INTW and LINT continue to trade lower, indicating the sector remains bearish. Below are two top options from the chain that stand out based on liquidity and technical parameters:
•
•
•
•
•
•
•
•
•
•
•
•
•
•
•
•
•
•
•
•
•
•
•
•
•
•
Aggressive bulls may consider the INTU20260327C435 or INTU20260327C440 into a bounce above the middle Bollinger Band of $437.66.
| 51.60 | -1.30% | Intel | Long |
| 32.37 | -2.17% | Intel | Long |
| INTW GraniteShares 2x Long INTC Daily ETF |
| LINT Direxion Daily INTC Bull 2X ETF |
Backtest Intuit Stock Performance
The backtest of Intuit's (INTU) performance after a -5% intraday plunge from 2022 to the present shows mixed results. While the 3-day and 10-day win rates are above 50%, the 30-day win rate is slightly higher at 55.60%, indicating that longer-term gains tend to be more frequent. The maximum return during the backtest period was 0.99%, which occurred on day 58, suggesting that while gains are possible, they are generally modest.
Take Immediate Action: Watch for Bounce or Breakdown
The sharp intraday move in Intuit reflects a critical inflection point in its technical profile. With the stock trading near its 30-day moving average and the Bollinger Band middle line, the next move could either confirm a short-term bottom or signal the beginning of a larger bearish trend. Traders should closely monitor whether the stock can hold above $432.48, the intraday low, and whether it can reclaim the $437.66 level. Meanwhile, the sector remains under pressure with Microsoft (MSFT) down 2.34%, reinforcing the bearish sentiment. Positioning via high-liquidity options or leveraged ETFs like INTW and LINT could offer strategic entry points for those expecting a near-term bounce.
Disclaimer: The content of this article solely reflects the author's opinion and does not represent the platform in any capacity. This article is not intended to serve as a reference for making investment decisions.
You may also like
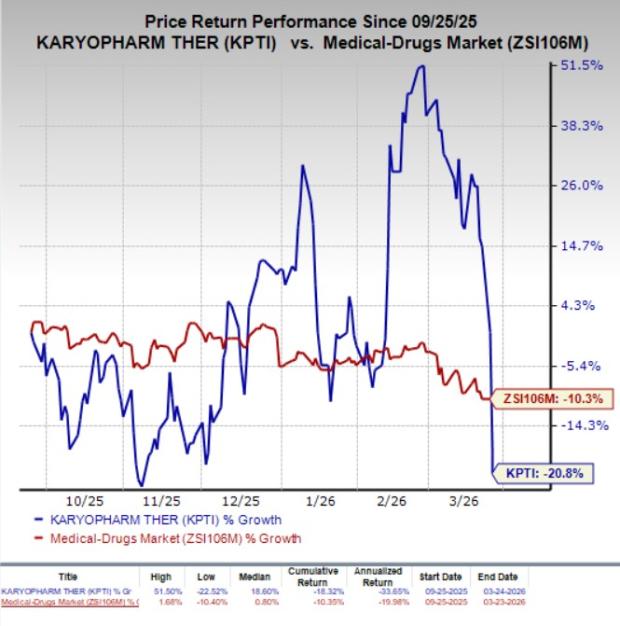
KPTI Shares Fall Following Varied Results from Phase III Myelofibrosis Combination Study
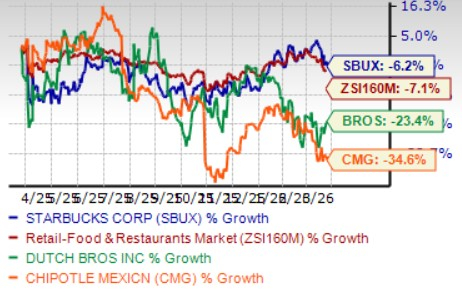
Can Starbucks' $2 Billion Savings Initiative Spark a New Wave of Margin Growth?
Gold Titan Falters: Newmont Jumps 3.8% as 'Gilded Civil War' Clouds Outlook

Are Options Traders Aware of Insights on Open Text Stock That We Might Be Missing?