Ondo Rejected 12.10: Volume Spikes Signal Distribution

Summary• ONDOTRY rallied from 11.47 to a peak of 12.10 before retracing to close near 11.51.• Volume surged during the 07:00 and 08:30 ET sessions, signaling active distribution near resistance.• Momentum indicators appear to have shifted lower as price rejected the 12.00 psychological level.• Volatility expanded sharply in the final hour, creating a wide trading range with mixed signals.• A potential bearish engulfing pattern emerged at the daily high, suggesting immediate selling pressure.
Ondo/Turkish Lira (ONDOTRY) traded between 11.47 and 12.10, opening at 11.47 and closing at 11.51 over the 24-hour window. The asset accumulated a total volume of approximately 1.05 million units, generating a notional turnover of roughly 12.4 million TRY.
Price Action and Structure
The 5-minute chart displays a distinct "W" pattern failure followed by a sharp rejection near the 12.10 level. Price initially broke above the 11.70 resistance with increasing volume but failed to sustain the breakout, leading to a rapid descent. The current close near 11.51 suggests that buyers may be exhausted, with 11.47 acting as the immediate support zone to watch for further downside confirmation.Momentum and Indicators
Relative strength appears to have weakened as the price retreated from overbought territory, potentially indicating a short-term correction. The MACD histogram likely shows a bearish divergence against the recent high, while the RSI may have dropped below neutral levels. These factors could imply that selling pressure is dominating the immediate timeframe, though a rebound to the 11.60 range remains possible if support holds.Volume and Volatility Analysis
Significant volume spikes occurred during the 07:00 and 08:30 ET intervals, coinciding with the price's failed attempt to breach 11.80 and the subsequent drop to 11.49. This divergence between high turnover and lower closing prices suggests aggressive distribution rather than accumulation. Volatility expanded notably in the final hour, with Bollinger Bands widening to reflect the uncertainty and potential for continued price swings in the next session.Key Levels and Outlook
Traders should monitor the 61.8% Fibonacci retracement level near 11.50 for potential support during the next 24 hours. If the price breaks below 11.42, a deeper correction toward 11.30 could unfold. Investors should remain cautious of false breakouts given the recent erratic volume patterns.Disclaimer: The content of this article solely reflects the author's opinion and does not represent the platform in any capacity. This article is not intended to serve as a reference for making investment decisions.
You may also like
‘Active Treasury’ is a dangerous misnomer that must not be ignored
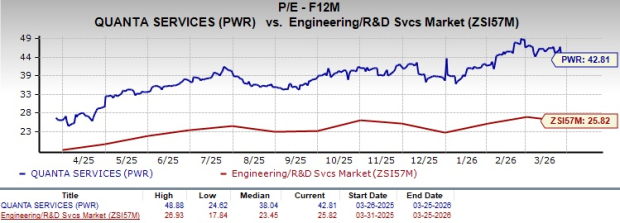
Is Quanta Positioned to Capitalize on the Surge of AI-Driven Demand in the Utilities Sector?
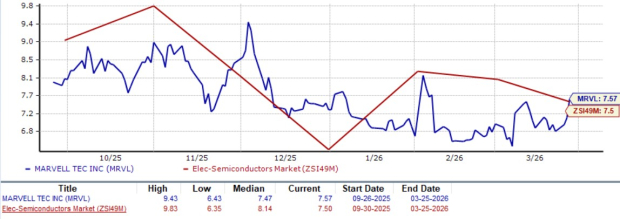
MRVL Achieves $6.1B in Data Center Revenue: Will the Growth Persist?
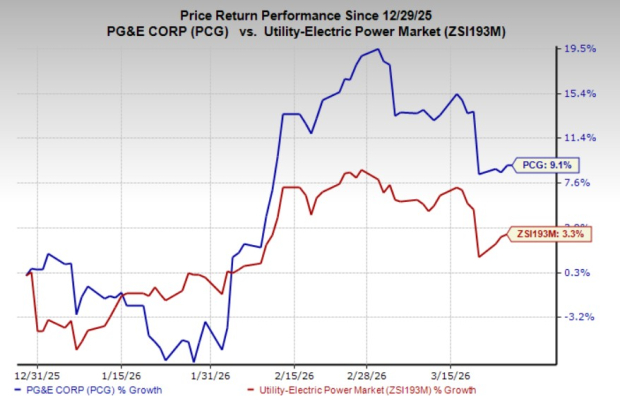
Here’s why including PCG stock in your portfolio is a smart move at this moment