
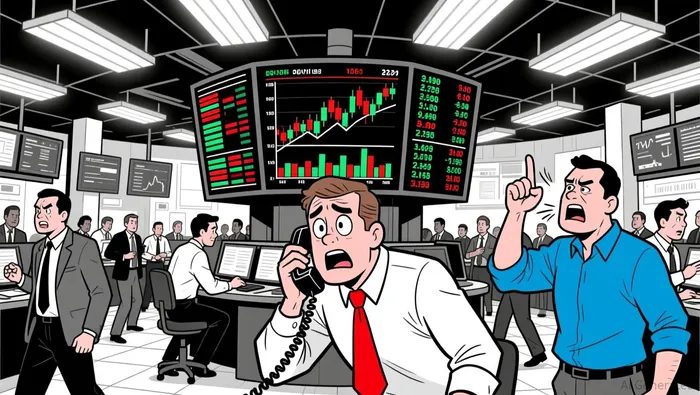
BANKTRY Surges on Massive Volume, Then Fails at 1.770

Summary• BANKTRY surged from 1.549 to a peak of 1.770, driven by massive volume spikes in the early morning session.• Price action formed a bullish engulfing pattern near 1.600, signaling strong buyer momentum before a sharp pullback.• Volume and turnover diverged during the decline, suggesting potential distribution as sellers overwhelmed the initial rally.• Support levels at 1.650 and 1.550 appear critical, with resistance forming near the 1.700 psychological mark.• Volatility expanded significantly during the 04:00–05:00 ET window, indicating high uncertainty and rapid price discovery.
Lorenzo Protocol/Turkish Lira (BANKTRY) opened at 1.549 and closed at 1.694, reaching an intraday high of 1.770 and a low of 1.518 over the 24-hour period. Total trading volume reached approximately 28.3 million units, generating a notional turnover of roughly 45.9 million US dollars. This session was characterized by a violent breakout followed by a volatile consolidation, reflecting intense market interest.
Technical Structure and Momentum
The 5-minute chart reveals a distinct V-shaped recovery that began around the 02:30 ET mark, where price reclaimed the 1.580 level after testing lower lows. This move appears to have triggered a cascade of buy orders, pushing the asset toward 1.770 within an hour. However, the subsequent rejection from 1.770 formed a potential double top structure, suggesting that buyers may be losing control. The 20-period moving average crossed above the 50-period moving average during the rally, confirming the short-term bullish trend, though the price is now testing the 50-period average as support.
Indicators and Volatility
Relative Strength Index (RSI) readings climbed into overbought territory above 70 during the peak, which often precedes a correction or consolidation phase. The MACD histogram showed strong positive momentum before flattening out, indicating a potential divergence between price strength and underlying momentum. Bollinger Bands expanded significantly during the 04:00–05:00 ET surge, capturing the high volatility, but have since contracted, hinting at a period of indecision. Price currently sits near the middle band, leaving the direction for the next session uncertain.
Volume Analysis and Future Outlook
Volume surged dramatically during the upward move, with the 05:00 ET candle showing the highest turnover, yet the price decline that followed occurred on slightly lower volume. This could imply that the initial buying pressure was exhausted rather than met with overwhelming selling. Fibonacci retracement levels suggest that 1.650 acts as a key support zone derived from the previous swing low. If the price holds above 1.650, a retest of 1.700 remains a possibility; otherwise, a deeper correction toward 1.550 cannot be ruled out.
Investors should monitor the 1.650 level closely for a potential breakout or breakdown in the next 24 hours. While the bullish momentum was strong, the sharp pullback warrants caution as market sentiment may shift quickly.
BANKTRY Trend Chart

Disclaimer: The content of this article solely reflects the author's opinion and does not represent the platform in any capacity. This article is not intended to serve as a reference for making investment decisions.
You may also like
GBP/USD Surpassing 1.3550 May Signal Upward Momentum—Failure to Hold Could Lead to a Decline Toward 1.3300

Colombia's Lame-Duck Tax Reform Sets Up Fiscal Transition Risk for New Congress
US-Iran Negotiations Collapse, Two Super Tankers Turn Back in the Strait of Hormuz