
Impact of High Oil Prices on Prices and Monetary Policies in China, the US, and Japan (¥1)
Since early March, there has been ongoing discussion in the market about whether rising oil prices could lead to "stagflation" in major economies. I have always used the term "mild stagflation" instead of "stagflation," and I believe that China will experience "stagnation without inflation." This article will discuss this issue.
1. The Oil Crisis of the 1970s: Why Did Prices Rise So Much?
Figure 1 illustrates the first and second oil crises. In the 1970s, Brent crude oil was priced at $1.8 per barrel, later rising to $2.7 per barrel, and the peak in early 1974 reached $13 per barrel. From early 1973 to early 1974, the price surged by 381%. This oil crisis caused a permanent change in the oil supply mechanism, resulting in persistently high prices thereafter.
At the end of the 1970s, Brent crude rose from $12.8 per barrel to $36.5 and $42.0 per barrel. From October 1978 to October 1979, the increase was 228%.
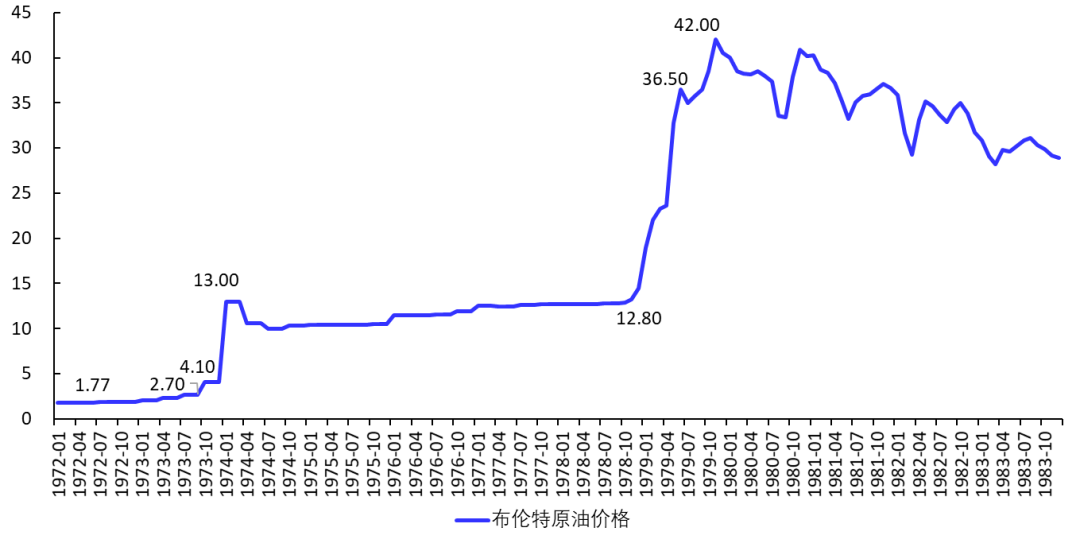
Fig. 1 Brent Crude Oil Price (USD/barrel)
Given such a surge in oil prices, it is easy to imagine the pressure on PPI and CPI. Figure 2 shows the US PPI and PCE year-on-year at the time (the correlation coefficient between these two price indices long remained at 0.75).
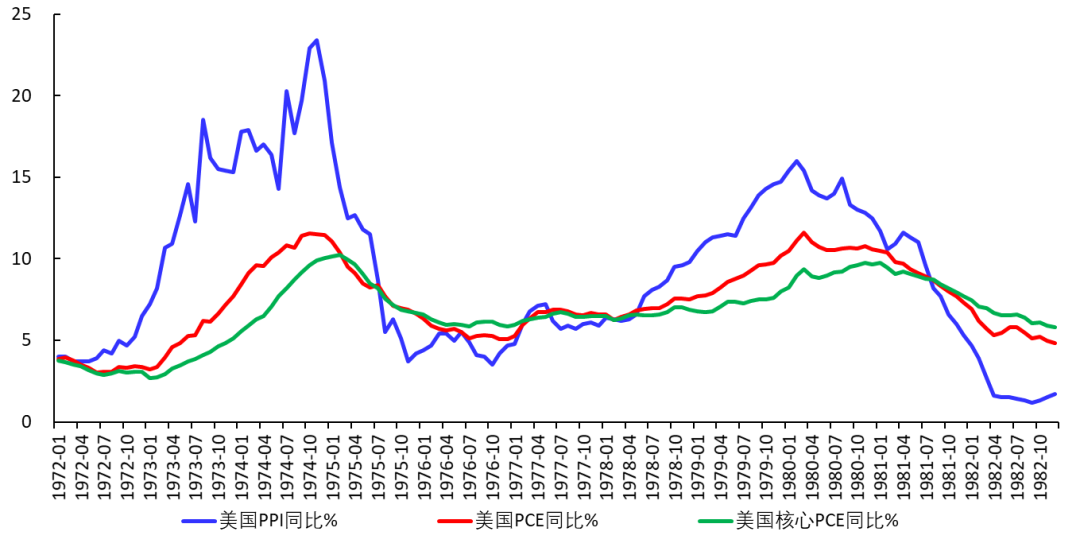
Fig. 2 US PPI and PCE Year-on-Year
2. What Else Led to Recession?
After both oil crises, the US, Europe, and Japan generally fell into recession, with GDP experiencing negative growth. Especially around 1980, after the US entered stagflation, the Federal Reserve curbed inflation through interest rate hikes, which in turn objectively deepened the recession.
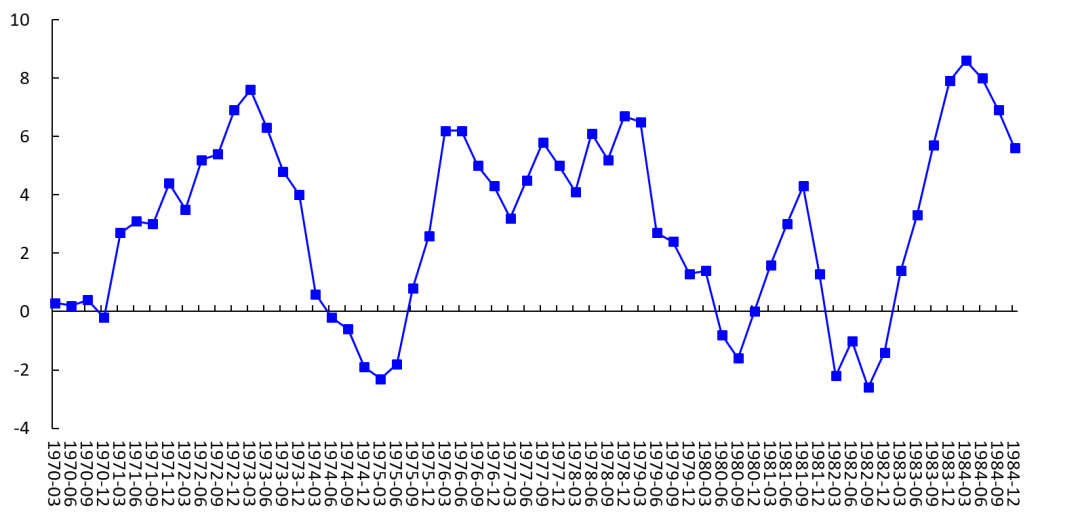
Fig. 3 US GDP Seasonally Adjusted Year-on-Year
Besides this, were there other reasons for the recession? I think another noteworthy issue is that industry accounted for a higher proportion back then.
Figure 4 shows that in 1973, the proportion of US manufacturing in nominal sector added value was 25.67%, in 1979 it was 24.58%, but now it is only 11%. This means that
[1] During the oil crisis in the 1970s, increased oil prices more easily passed down the industrial production chain; conversely, when oil prices fell, PPI, CPI, and PCE were also more likely to fall in tandem.
[2] At that time, the economy was more easily hit by high oil prices and more susceptible to recession.
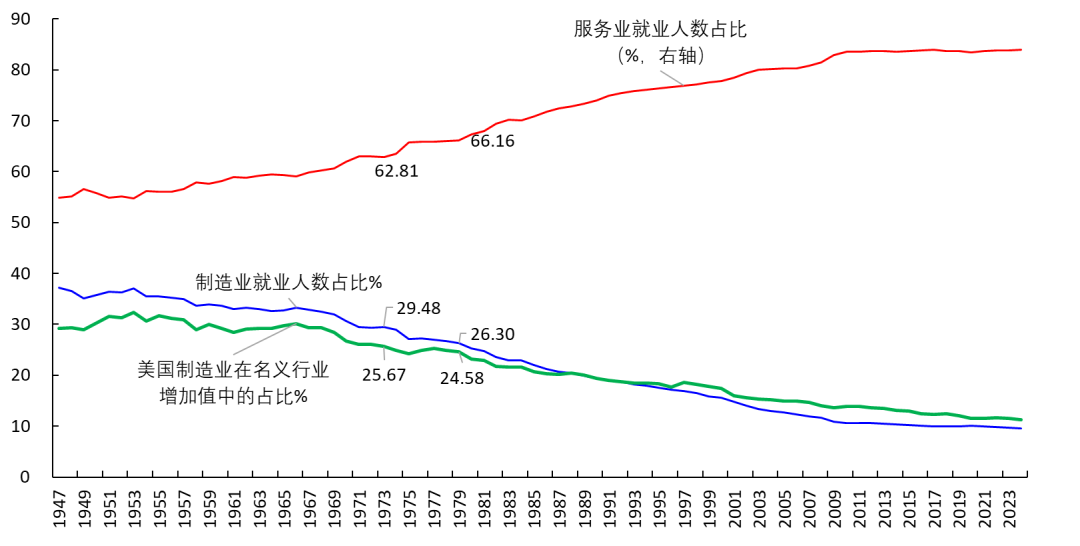
Fig. 4 Manufacturing Share
By contrast, industry now makes up a lower share and the service sector dominates, so GDP growth is less affected by oil price increases. However, on the other hand, once oil price hikes are transmitted to service sector prices, it will be difficult for service prices to come down due to their strong stickiness, even if oil prices decline in the future. This will make inflation more entrenched.
3. It Was Easier to Exit Recession Back Then
Figure 5 shows the relationship between the US natural interest rate (neutral rate) and the manufacturing share, which are highly correlated. This is normal, as the natural rate represents the marginal rate of return on capital. In the 1970s, the US had a high natural rate, indicating high investment returns, investment growth, consumption growth, and GDP growth (see my publication for details). Therefore, once a recession occurred, it was easier to recover from it.
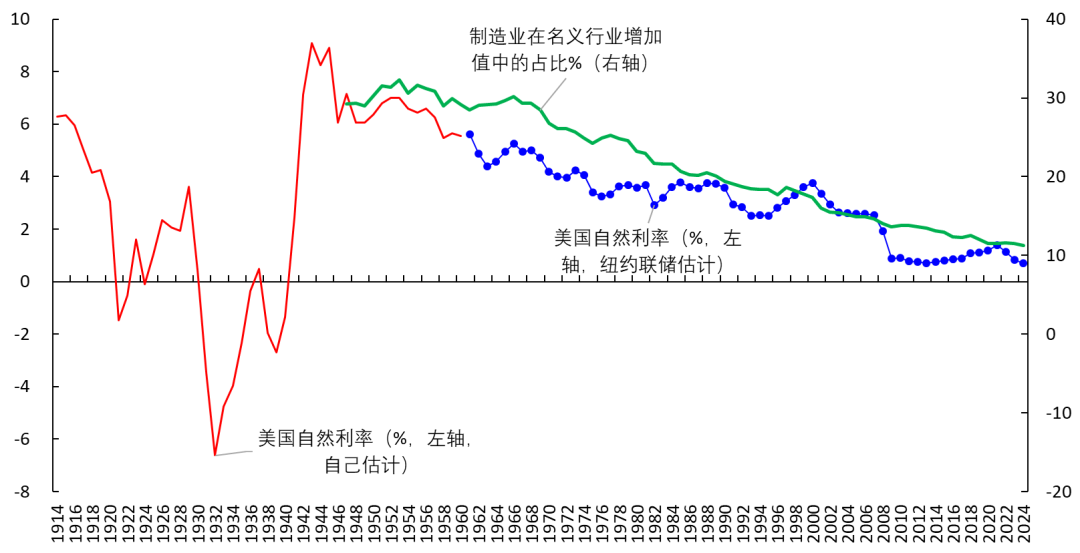
Fig. 5 Manufacturing Share and Natural Rate
The current situation is different. The US currently exhibits a severe K-shaped economy (1, 2, 3, 4, 5). On one hand, investment in AI industries is booming, boosting GDP and creating many new billionaires with strong consumption. On the other hand, these economic gains have little relationship with the middle- and lower-income population, whose income and consumption growth remain weak. This means that once the economy enters a recession, it is hard to recover by stimulating consumption alone—instead, a larger scale of AI industry investment is necessary to pull the economy out of recession.
China faces a similar problem (see details), which will be discussed below.
Let’s now look at the current situations in the US, China, and Japan.
4. United States: Mild Stagflation, No Rate Hikes, Possible Rate Cuts
(1) Impact of Oil Prices on US Inflation
Here, I will directly quote a research paper. On April 6, 2026, economists at the Federal Reserve Bank of Dallas published a working paper entitled “The Impact of the 2026 Iran War on U.S. Inflation: A Scenario Analysis,” written by Lutz Kilian, Michael D. Plante, Alexander W. Richter, and Xiaoqing Zhou.
The paper assesses the potential impact on US inflation from oil supply disruptions caused by the US-Israel-Iran War. The core scenario assumes a complete closure of the Strait of Hormuz, leading to a 20% disruption of global oil supply. The paper uses a DSGE model to simulate quarterly WTI oil prices (pre-war level at about $60/barrel) under three scenarios, in which the Strait is closed for 1, 2, or 3 quarters:
[1] A one-quarter closure would push average oil prices to $110/barrel in April 2026;
[2] A two-quarter closure would peak oil prices at $132/barrel in July 2026;
[3] A three-quarter closure would peak oil prices at $167/barrel in October 2026.
The study finds that closing the Strait for 1, 2, or 3 quarters would raise overall PCE year-on-year by 0.35, 0.79, and 1.47 percentage points in Q4 2026, respectively; the impacts on core PCE year-on-year would be 0.18, 0.31, and 0.49 percentage points, respectively. The research also finds that these shocks have very limited influence on households' short-term (one-year) and long-term (five- to ten-year) inflation expectations.
(2) Why Can't the Impact Fully Pass Through to PCE?
The paper notes that the impact of this oil price rise on PCE and core PCE year-on-year is small, much smaller than in the 1970s (see Figure 2). I believe there are three main reasons for this:
[1] This oil price increase is far smaller than during the two oil crises in the 1970s (see Figure 1).
[2] The share of the industrial sector in the US is currently very low.
[3] The K-shaped economy in the US is severe, making it difficult for PPI increases to be fully reflected in PCE. Simply put: the public has only so much money—if fuel prices go up, they spend more on fuel and less elsewhere; in the end, it all gets spent (US household savings rates are very low). Even if prices rise, if the public can't afford to spend, it doesn’t matter. (China’s situation is similar but slightly different; see below.)
(3) Projections in the Fed’s SEP
After the March 18 FOMC meeting, the Federal Reserve released its Summary of Economic Projections, showing forecasts for economic indicators as follows:
Table 1 Fed Economic Projections
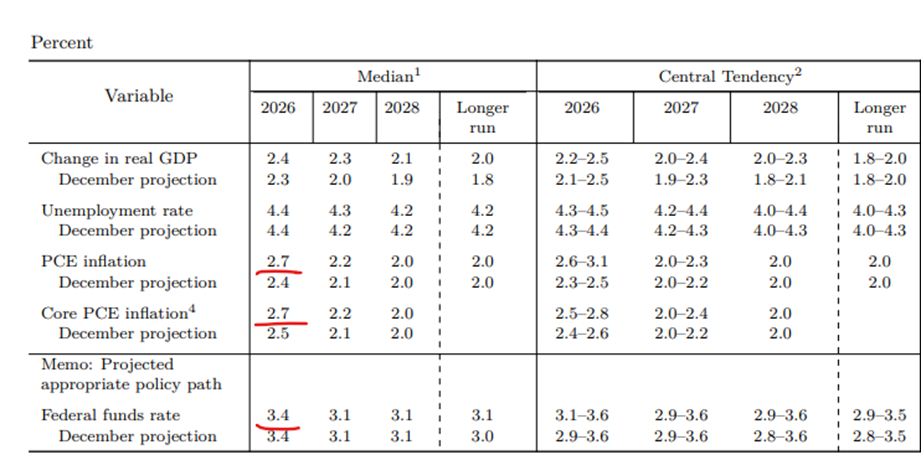
The Fed slightly raised its forecast for 2026 core PCE from 2.5% to 2.7%, with almost no change to the 2027 forecast and no change for 2028.
(4) Rate Cut Expectations
Using the US neutral interest rate and the Fed’s projections for core PCE, it is easy to calculate the number of expected hikes/cuts (see here for the method). After the rate cut on December 10, 2026, Federal Reserve Chair Powell announced that interest rates had returned to the “neutral range” (see here), and the released Summary of Economic Projections implied another rate cut in 2026 (see here).
Table 1 shows that the Fed raised its 2026 core PCE forecast by 0.2 percentage points. According to my calculations, after the increase, the nominal natural rate will be in line with the federal funds rate (3.5-3.75%), meaning that expectations for another rate cut in 2026 are no longer valid. This is also reflected in the rate dot plot released (see Figure 6).
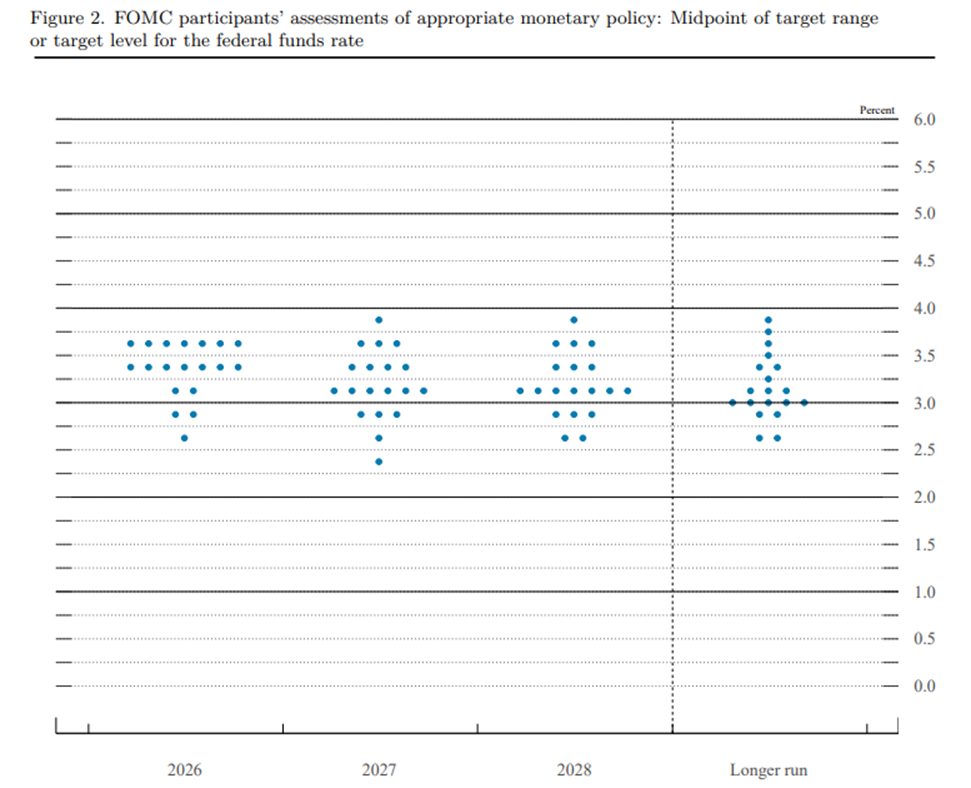
Fig. 6 Rate Dot Plot (from March 18, 2026 SEP)
According to the aforementioned Dallas Fed paper, a 3-quarter closure of the Strait of Hormuz would raise US core PCE year-on-year by 0.49 percentage points, causing the federal funds rate to fall below the nominal natural rate. Sois a rate hike warranted? I believe not. The reasons are:
[1] If oil rises to $167/barrel, it will obviously drag on the US economy. At that time, loose monetary policy is needed—meaning keeping the federal funds rate unchanged, or cutting rates. From this perspective, those in the US market who expected a rate hike in October in mid-March were way off the mark.
[2] The US K-shaped economy is too severe, and the labor market is just barely in weak equilibrium (as recently noted by Fed Vice Chair Jefferson in his latest speech), which means that even if core PCE rises slightly, there is no case for hiking rates.
If the labor market weakens in the future for any reason, a rate cut may even be necessary.
(5) Regarding US Treasury Yields
In March, US Treasury yields rebounded sharply but have recently declined somewhat. If the Fed doesn’t need to hike rates and may even need to cut, an obvious conclusion is that if US Treasury yields surge again due to some trigger in the future, it will be safe and bold to go long. For example, if the US 10Y and 30Y yields are now 4.27% and 4.89% respectively, and jump to 4.4% or over 5% in the future, it will be a safe opportunity to go long.
5. Japan: Mild Stagflation, Accelerated Rate Hikes
I believe Japan’s natural rate is roughly between -1% and 0% (1, 2, 3). The Bank of Japan has no unified method for calculating the real interest rate (see here), but I believe the real rate is still below the natural rate (see Figure 7), meaning that Japan’s current monetary policy is still loose.
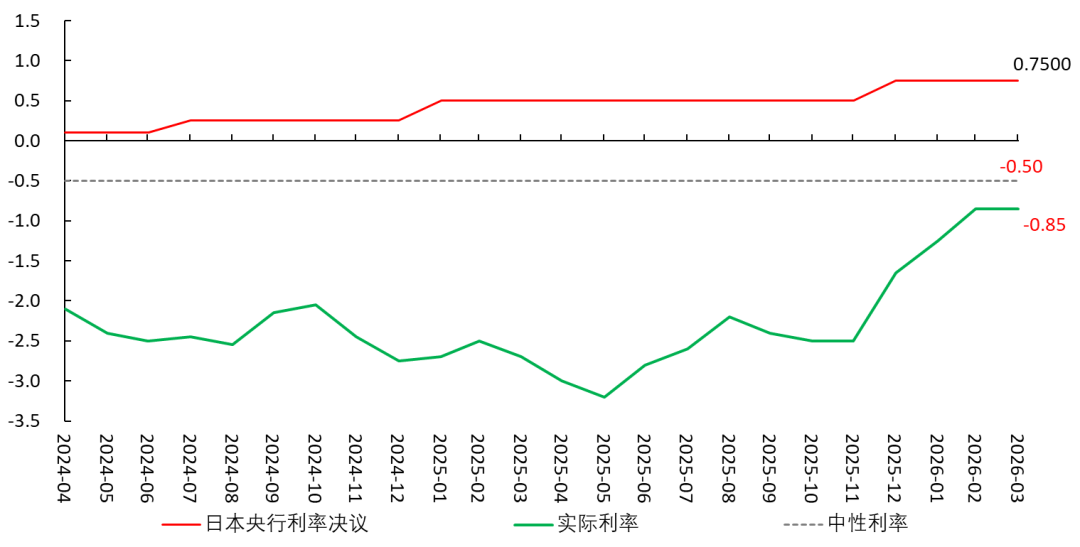
Fig. 7 Japan: Real Rate and Policy Rate
At the end of 2025 and the beginning of 2026, the Bank of Japan is hoping that the spring wage negotiations ("Shunto") will result in higher wages, boosting Japan’s inflation trend and leading to a virtuous cycle of rising wages and inflation (see here). The outbreak of the US-Israel-Iran War will push up Japan’s core CPI (excluding fresh food), making it easier for Japan’s core CPI to trend toward the 2% long-term target (see here).
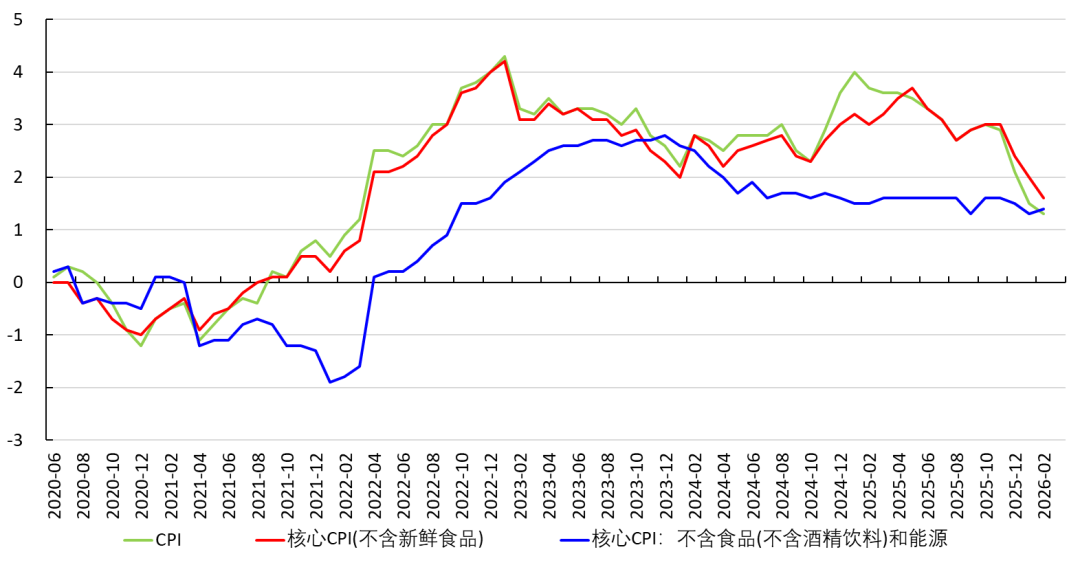
Fig. 8 Japan CPI
After the war broke out at the end of February, Japanese government bond yields rose sharply, reflecting expectations for rate hikes. Recently, the 10y government bond yield has not declined significantly.
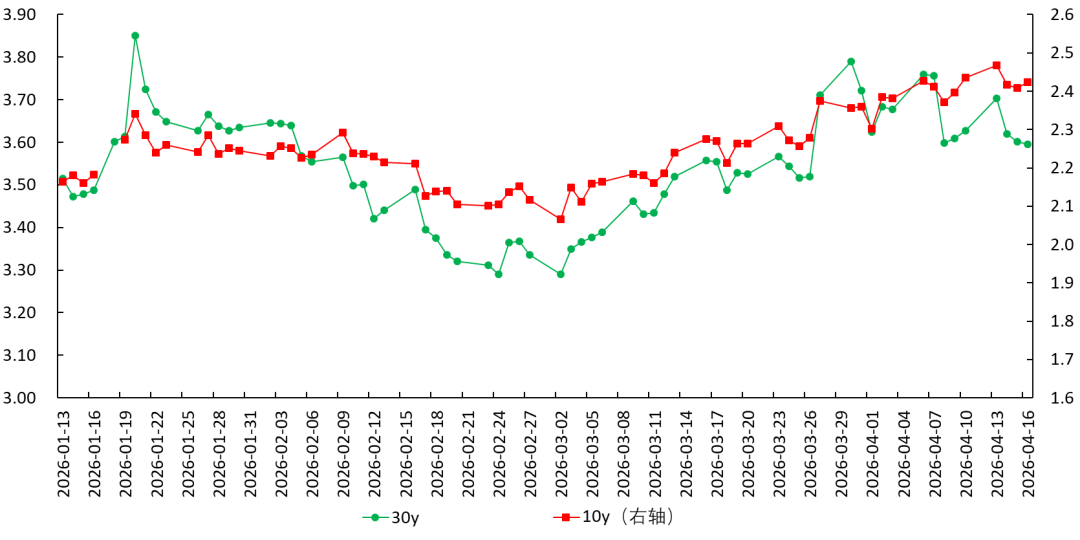
Fig. 9 Japan Government Bond Yields
I believe that at the monetary policy meeting on April 27–28, the Bank of Japan will raise rates by 0.25%, bringing the policy rate up to 1%. However, as Japanese household income and consumption growth are both weak, rate hikes will hit consumption.
6. China: Stagnation without Inflation
(1) It Is Difficult for PPI Rises to Transmit to CPI
Disclaimer: The content of this article solely reflects the author's opinion and does not represent the platform in any capacity. This article is not intended to serve as a reference for making investment decisions.
You may also like
Forex Today: Investors look for direction as US-Iran negotiations progress
WAL (Walrus) 24-hour volatility at 55.9%: Binance trading volume surge and technical breakout signals drive movement
NEIROCTO24 fluctuated 59.0% within 24 hours: short-term trading order flow and leveraged amplification drive rebound