
On one side is an all-time high, on the other is a plunge in oil prices! Four charts explain why the market is so crazy

The global market last week can truly be described as a period worthy of going down in history.
The US stock market closed at a historic high, not only completely erasing the losses triggered by the Iran war, but also effortlessly setting new highs. Meanwhile, WTI crude oil posted a decline of over 10% for the second consecutive week. #IranCrisisTracking#
In such a volatile market environment filled with terms like “historic,” “rare,” and “record-breaking,” charts often illustrate the situation more clearly than mere text. Charts not only enable us to look back at what has happened, but often provide important clues for the market's next moves.
The following four charts correspond to four forward-looking insights worth paying attention to after last week’s extreme market swings.
Chart 1: The Nasdaq Composite Index sets the longest daily winning streak since 1992
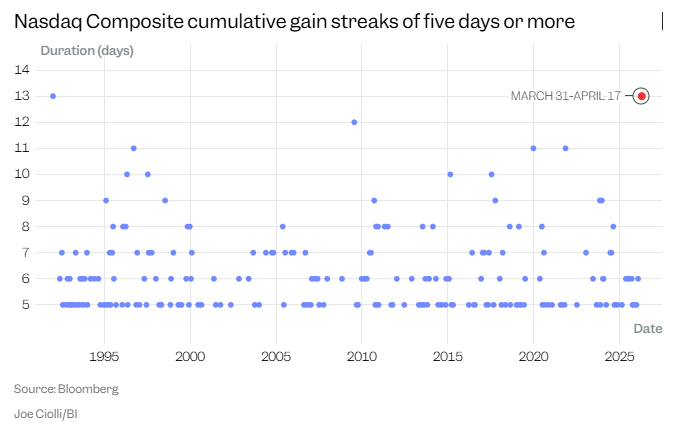
The Nasdaq Composite Index rose for 13 consecutive trading days, reflecting the exceptionally strong momentum of this rebound, which has been almost unstoppable. This rally has not only driven tech stocks continuously higher, but has also helped all major US indexes fully return to historic highs.
More importantly, the technology sector has become the core engine of this upward trend, indicating that investors have returned en masse to growth stocks, especially those relating to artificial intelligence.
In fact, this rebound was already unfolding clearly even before reports of the Strait of Hormuz reopening temporarily fueled market sentiment. Although the previously improved outlook now faces new uncertainties, if these risks eventually ease, the market’s focus is likely to shift back to corporate earnings season itself, as well as whether corporate profit growth can support further market advances.
Chart 2: Energy stocks give back some of their war-related gains
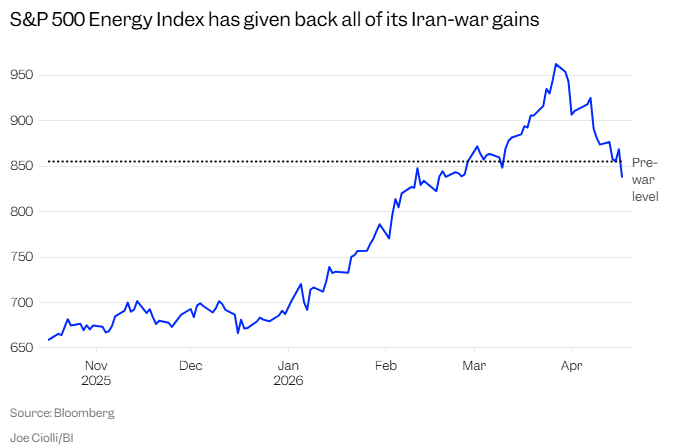
After the Iran war broke out in March, energy stocks experienced a notable surge, almost mirroring the movement of the broader market. In other words, when the overall market was under pressure, the energy sector benefited from higher oil prices and strengthened; conversely, as risk appetite returned and oil prices fell, energy stocks simultaneously lost support.
Since the earnings of energy companies are closely tied to oil prices, the recent sharp pullback in oil amid ongoing US-Iran peace talks has also led to a significant sell-off in energy stocks.
However, even after the latest drop, oil prices are still about 25% above pre-war levels. More importantly, in this kind of historically disruptive geopolitical backdrop, it is difficult for the market to declare risks completely eliminated. If oil prices rebound again, energy stocks under pressure could quickly recover as well.
Chart 3: Software stocks still show significant gaps from historical highs
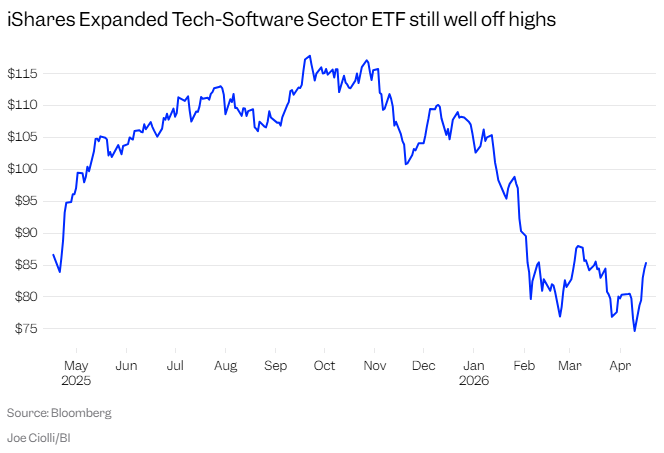
Judging by the rebound from recent lows, software stocks have performed encouragingly. Previously, this sector suffered from a wave of concentrated selloffs due to a series of AI tool shocks, so it was naturally in need of a significant recovery.
On the other hand, software stocks are still quite a distance from their previous highs, suggesting that investors haven’t forgotten their prior concerns about this sector. Although AI trades have once again become the main theme in the market, this is not necessarily good news for industries previously seen as most vulnerable to AI disruption.
In other words, capital is again chasing AI dividends, but that doesn’t mean worries about AI’s threat to traditional software business models have entirely disappeared.
Chart 4: The US dollar is approaching multi-year lows again
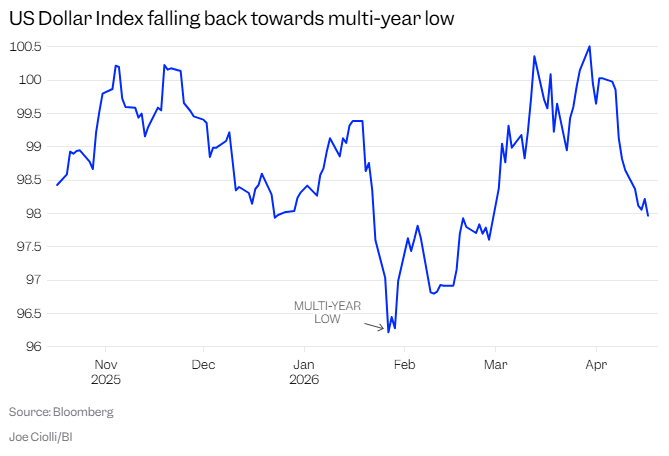
As market discussions about rate cuts resume, and the inflation concerns previously caused by rising oil prices are temporarily eased, the dollar has weakened again, nearing its lowest level in years.
A weaker dollar impacts different parties in different ways. For a multinational with substantial overseas revenues, a weak dollar typically benefits its performance, since revenues translated back into dollars appear higher. However, for the average consumer traveling abroad, a weaker dollar means reduced purchasing power and less goods and services for the same amount of money.
This precisely encapsulates the “two-sidedness” of market reactions under the Iran war scenario—a single market fluctuation can impact different assets, enterprises, and investors in divergent or even completely opposite ways.
Disclaimer: The content of this article solely reflects the author's opinion and does not represent the platform in any capacity. This article is not intended to serve as a reference for making investment decisions.
You may also like
What to Expect in the Week Ahead (FOMC Rate Decision and Earnings from AAPL, GOOG, AMZN, META and MSFT)
ENSO (ENSO) fluctuates by 69.3% in 24 hours: Trading volume surges over 100 times, triggering speculative volatility
D (DarOpenNetwork) 24-hour amplitude at 50.4%: Active trading and capital rotation drive dramatic price volatility