
Where is gold headed next? The $5,044 level deserves close attention

Forex Network April 21— During the European session on Tuesday (April 21), gold traded near $4,800 per ounce. Progress in ceasefire negotiations at the Strait of Hormuz and Kevin Walsh's attendance at the Federal Reserve Chair nomination hearing were the core factors influencing gold price trends.
During the European session on Tuesday (April 21), spot gold was quoted at around $4,787 per ounce, down 0.68%, retracing last week’s 2% gain. Last week's rise mainly benefited from the temporary easing of tensions in the Strait of Hormuz region, which not only alleviated market concerns about rising inflation but also reignited investors' expectations for Fed rate cuts. Meanwhile, a weaker dollar provided additional support to gold prices, with the dollar index falling 0.56% for the week, further boosting gold’s upward movement.
Although the market has slightly warmed up, current gold prices are still about 9% lower than levels before the conflict erupted on February 27. This stands in sharp contrast to the S&P 500 index—U.S. equities have fully recovered lost ground and climbed 3% above their baseline at that time, highlighting gold’s relative weakness in the restoration of risk sentiment.
However, bullish momentum indicators have comprehensively improved: futures long positions on gold have significantly rebounded, ETF inflows have accelerated, and options traders have greatly increased their bullish bets. Gold ETFs have seen net inflows for three consecutive weeks, with a net inflow of 21.7 tons in the week ending April 17, pushing this year’s cumulative net inflows to 117.4 tons. Yet, the drag from March outflows still lingers, as this inflow has not made up for last month’s sizable net outflow of 89.6 tons.
The structural trend of global central banks continuing to net-purchase gold remains unchanged. According to World Gold Council data from February, global central bank monthly net gold purchases stood at 27 tons, in line with the 2025 monthly average level. However, March central bank purchase data showed evident distortion, failing to reflect the true long-term demand trend.
Among them, Poland increased its holdings by 11 tons, China by 5 tons, and Uzbekistan by 9 tons. All three countries took advantage of the price pullback window to boost allocations. According to central bank data from various nations, the Turkish central bank significantly reduced its holdings by 118 tons in March, using direct sales and swap operations to raise funds in response to soaring energy import costs and to defend the lira exchange rate. Turkish central bank governor Karahan stated that the gold involved in the swap agreements will be repurchased after expiry, meaning this reduction does not represent a strategic abandonment of gold allocation but a short-term funding measure to cope with forex liquidity strains.
The primary driving factor for short-term gold moves remains the progress of U.S.-Iran negotiations. The current ceasefire agreement is set to expire Wednesday evening U.S. Eastern Time, and confirmation of a second round of direct talks has not been announced. If the geopolitical situation continues to cool, it will benefit non-yielding assets like gold; but if negotiations collapse, the safe-haven premium will return, a factor that caused notable pressure on gold prices in March.
On Tuesday, Kevin Walsh attended the Senate hearing for the Fed Chair nomination, adding a fresh variable to gold price trends. Walsh has historically adopted a hawkish stance on Fed balance sheet reduction, raising market concerns about his ability to implement the Trump administration’s push for rate cuts. If he signals a hawkish stance, it will undermine rate-cut expectations supporting gold’s rebound this week; if he leans dovish, it will trigger doubts about the Fed's independence from external influence.
Additionally, inflation data from the UK and Japan to be released later this week will directly reflect the extent of energy supply shocks transmitted to overall consumer prices, and further influence the pace of global central bank monetary easing, indirectly impacting gold prices.
Technical Analysis
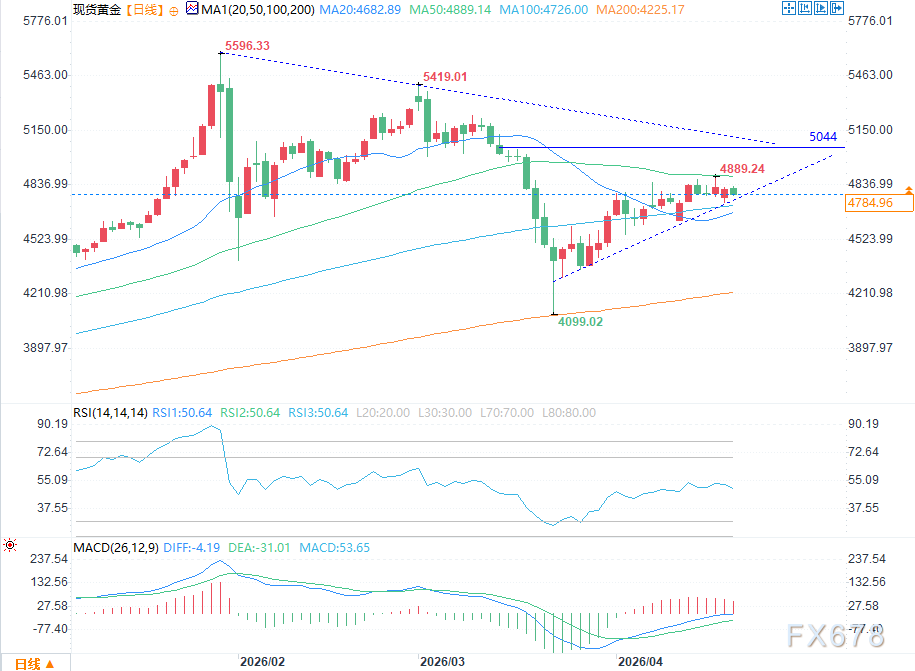
(Spot Gold Daily Chart Source: Easy Forex Network)
The medium-term bullish pattern for spot gold remains unchanged, with price securely running above the 200-day moving average ($4,225). Since rebounding from the $4,099 low, gold has recaptured the 20-day moving average ($4,683), but its rise has temporarily paused and is consolidating in a narrow range between $4,683 and $4,889.
If gold can close strongly above the 50-day moving average ($4,889), it will confirm a short-term breakout pattern, paving the way for another test of the previous resistance above $5,000. After breaching this range, the main downward trendline connecting $5,596 and subsequent secondary highs remains the core structural pressure for medium-term upside. Only a valid breakout above this trendline would formally declare the end of the gold price adjustment phase and open up room to return to historic highs.
Disclaimer: The content of this article solely reflects the author's opinion and does not represent the platform in any capacity. This article is not intended to serve as a reference for making investment decisions.
You may also like
ARIA 24-hour amplitude reaches 46.7%: trading volume surges accompanied by short-term speculative volatility
CORE (CORE) fluctuates 40.5% in 24 hours: Oversold rebound driven by whale buying and short liquidations
Dow Jones Industrial Average futures slip on Oil surge, hot US Retail Sales
GBP/USD slips as strong US Retail Sales revive USD demand