
Oil prices surge and interest rate outlook create dual pressure, leaving the future of gold shrouded in uncertainty

Huitong Network, April 24—— After four consecutive weeks of gains, the price of spot gold experienced a phase correction this week, marking the first single-week decline in nearly five weeks.
On Friday (April 23), during the European session, the spot gold price stabilized after a period of decline. Bullish funds entered the market in a timely manner, executing support operations at the key $4,600 level, which helped push the gold price up slightly. However, it is important to clarify that this stabilization is only a short-term technical adjustment and not a signal of a trend reversal—core bearish factors that have continued to pressure gold prices this week have not dissipated, and there have been no obvious signs of a bullish reversal in technical indicators. The room for the bulls to rebound remains very limited. The following section will provide a detailed analysis of the current key price ranges, as well as the substantive market changes required to reverse the current bearish sentiment.
From the daily chart perspective, spot gold showed a slight rebound on Friday, primarily because traders moved in to support the price near the recent low at $4,640, temporarily halting the price decline. However, caution is warranted as this price level is both an important short-term support and a critical dividing line between bulls and bears. If it is effectively breached downward, it could trigger stop-loss selling and potentially set off a rapid decline in gold prices.
In the short-term technical outlook, the primary resistance for gold is concentrated near the 50-day moving average, which is currently at $4,870.42 and serves as a key indicator of gold’s strength. On April 17, the price tested this resistance but failed to break through, after which the market continued a weak consolidation pattern, characterized by lower highs and lower lows. This pattern clearly reflects heightened selling sentiment in the market, persistently weak buying demand, and bears currently holding control over the market direction.
Moreover, the current gold price is trading below the long-term pivotal level of $4,744.34, placing it in an overall weak zone. Going forward, if selling pressure does not ease and the crucial support at $4,644.46 is broken, gold is likely to fall further. The next significant support will be the long-term 61.8% Fibonacci retracement level at $4,541.88, which is also an important short-term defensive line.
This week, the international crude oil market saw explosive growth. The price of Brent crude oil surged by around 18%, closing firmly above $105 per barrel and reaching a stage high. This surge was not accidental; the main trigger was the continuously escalating geopolitical tensions in the Strait of Hormuz, a vital global oil shipping corridor. The turmoil here directly raised concerns about oil supply shortages, fueling a sharp rise in oil prices. This trend has also created a ceiling for gold prices that is difficult to break through—an inverse relationship often overlooked by many market participants.
From a market transmission logic, there is a clear negative correlation between rising oil prices and gold’s performance: Rising oil prices push global inflation higher, which, in turn, forces the Federal Reserve to maintain its current high interest rate policy, delaying any rate-cutting cycle. High U.S. rates further support the dollar index, drawing global capital toward dollar assets and various high-yield bonds. As a non-yielding asset, gold suffers both from a strong dollar and capital outflows, resulting in a double whammy that severely constrains its upside potential.
It must be noted that one of gold’s core traditional attributes is as an “inflation hedge”: investors buy gold to protect against asset depreciation when inflation rises. However, this logic holds only if the market is in a rate-cutting cycle, or if rate cuts are widely anticipated. In the current environment, not only do major global economies maintain high interest rates with no signs of easing, but high oil prices above $100 per barrel are solidifying the high-inflation scenario, limiting gold’s function as a hedge. Meanwhile, rising U.S. 10-year Treasury yields and a stable, strong dollar combine so that, even amid ongoing geopolitical tensions, upward space for gold is effectively sealed off—these remain the main forces suppressing gold’s price.
The gold market reached a critical turning point when the price attempted to break the 50-day moving average. Despite an initial breakout attempt, gold failed to hold above this level and quickly retreated. This was not accidental; instead, it was a key signal of market reversal. In financial markets, when an asset price stalls at key resistance, it typically means buying power has been exhausted; lurking bears take the opportunity to attack while bulls take profits or cut losses.
This logic explains why gold ended a streak of four consecutive weekly gains, recording its first weekly loss in five weeks. This failed breakout completely reversed bullish market momentum, and sentiment has now turned cautious. So far, there is no sign of a rebound in bullish momentum, and the short-term trend remains weak.
Despite the dominance of bearish factors in the current gold market, one bullish dynamic remains noteworthy: the steady recovery in physical gold demand from India and China, the world’s two largest gold consumers. Driven by seasonal consumption peaks and market recovery, both countries have seen a marked rise in physical gold purchases. At the same time, tightening global supply has caused the spot premium for gold in the Indian market to narrow, reflecting strong current demand in the physical gold market.
It is important to emphasize that physical gold demand is relatively rigid and not likely to fade quickly due to rising U.S. yields or a stronger dollar. In fact, it can provide some bottom support for gold, preventing excessive price declines. However, at present, the strength of physical buying remains limited and is not yet sufficient to offset the systematic drag brought by high interest rates and a strong dollar. Thus, it is difficult to reverse the current weak trend for gold in the short term.
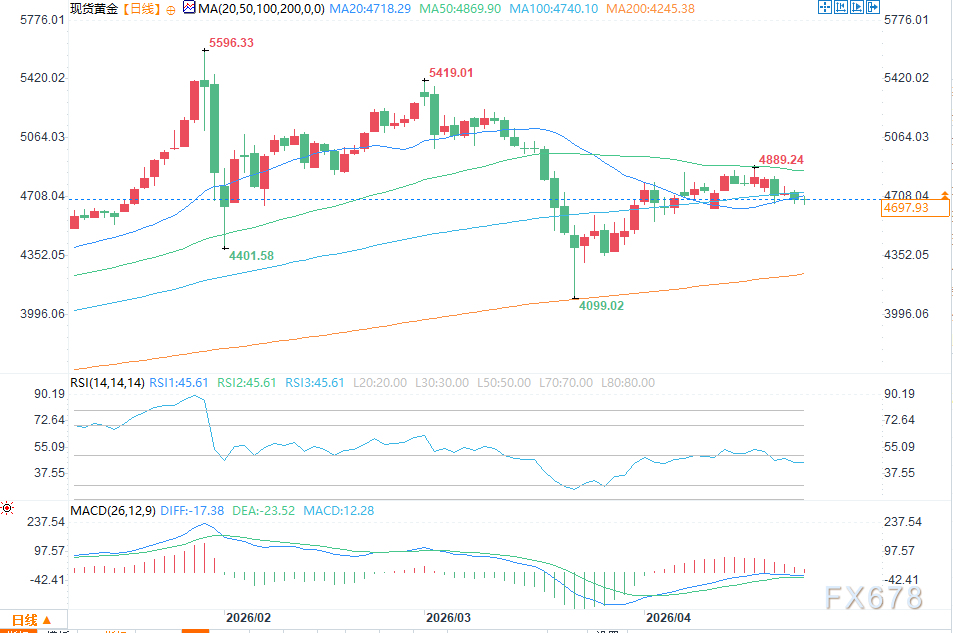
(Spot gold daily chart source: EasyHuitong)
Based on the current market environment and technical indicators, it is not recommended for investors to chase gold at high levels in order to avoid becoming passively trapped. The most rational trading strategy is to wait patiently for the gold price to drop to its core value range at $4,495.33—$4,401.84 (UTC+8), closely observe the buying strength at those lower levels, and then consider long positions.
From a long-term perspective, the 200-day moving average at $4,245.95 (UTC+8) is the key anchor for gold’s long-term trend. As long as this support is not effectively breached, the overall bullish structure for gold will remain intact, and a “buy-the-dip” strategy continues to be valid.
Disclaimer: The content of this article solely reflects the author's opinion and does not represent the platform in any capacity. This article is not intended to serve as a reference for making investment decisions.
You may also like
NZD/USD rises as US Dollar weakens on renewed US-Iran talks hopes
BLEND (FluentNetwork) surges 3900% in 24 hours: Multiple CEX listings and mainnet launch directly drive growth
IR (InfraredFinance) fluctuates by 41.0% in 24 hours: trading volume surge triggers post-pump sell-off
StakeStone (STO) 24-hour volatility at 40.1%: Trading volume surge drives rebound without fundamentals