
Goldman Sachs Trading Desk: Five Major Signals Flashing, U.S. Stocks Enter a 'Post-High Pullback Window'

The S&P 500 Index has quietly returned to historical highs after the severe volatility in April, but internal alarms have already been sounded on the Goldman Sachs trading desk.
John Flood, a trader at Goldman Sachs, clearly pointed out in a weekend report that although he believes the S&P 500 Index will be significantly higher throughout 2026 compared to the current level, there are five major warning signals flashing simultaneously, and the trading desk is preparing for a near-term pullback at the index level.
Meanwhile, another Goldman Sachs trader, Brian Garrett, also recorded unusual large-scale deleveraging by hedge funds in his "Weekend Memo" report. Both agree, however, that if a pullback does occur, it should be viewed as a buying opportunity.
The timing of this warning is quite subtle—this week will be the busiest of the year, with both the Federal Reserve and the Bank of Japan set to announce rate decisions. About 44% of the S&P 500's market cap will report earnings this week, including Google, Microsoft, Amazon, and Meta after the bell on Wednesday, and Apple after the bell on Thursday.
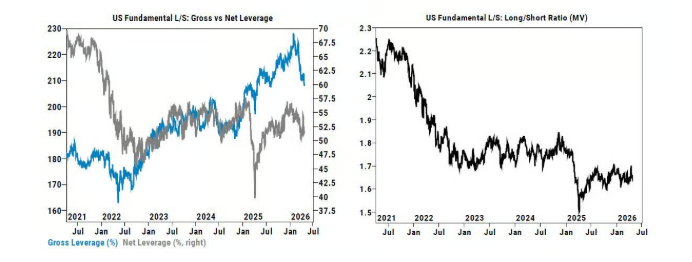
Signal One: Hedge Funds Hit the Brakes, Largest Weekly Deleveraging in Seven Months
Goldman Sachs prime brokerage data shows that overall total trading activity fell for the first time in 13 weeks last week. The scale of nominal deleveraging in US equities was the largest in seven months (since September 2025), mainly driven by risk unwinding. By sector, Consumer Discretionary and Technology saw the most aggressive deleveraging, ranking as the third-largest single-week deleveraging in the past five years.
Flood identified this as the first of the five warning signals: After significant covering of macro short hedges, total leverage has noticeably contracted. Short interest in US-listed ETFs fell by another 1.4% last week, down 21.5% month-to-date, led by covering in Credit, Information Technology, and small-cap ETFs.
Garrett described the net exposures of hedge funds as "maintained relatively restrained within a +/-53% range all year" and characterized this as "prudent risk management in a market environment marked by frequent 'unknown unknowns'.
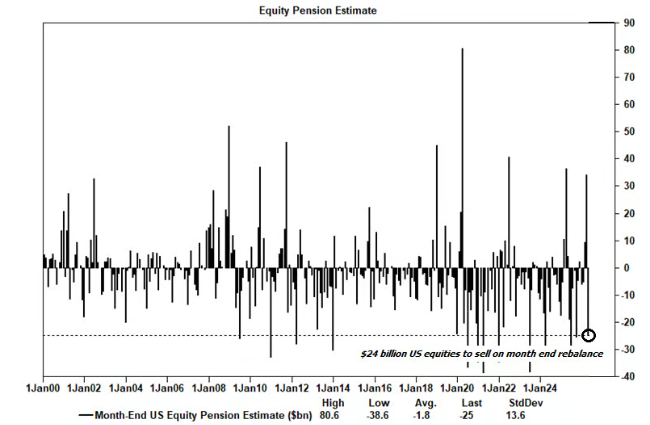
Signal Two: Month-End Pension Rebalancing Pressure Hits Record High
The second signal comes from passive selling. Goldman Sachs estimates that month-end April pension rebalancing will create about $25 billion in US equity selling demand, ranking among the top 15 largest selling estimates since 2000. Excluding quarter-end factors (including both monthly and quarterly rebalancing), this would be the largest single-month selling estimate ever recorded.
Measured in absolute terms, this $25 billion selling scale ranks at the 83rd percentile of all buy/sell estimates over the past three years, and the 92nd percentile since January 2000. Historically comparable non-quarterly selling estimates are: about $20 billion each in November and April 2020, about $19 billion in May 2025, and about $18 billion in October 2022.
Signal Three: CTA Buying Exhausted, Turning Into Potential Sellers
The third signal points to trend-following strategies (CTA). According to the Goldman Sachs futures trading desk, since April, the CTA group has been the most important force driving global equity market gains, buying about $53 billion in global stocks month-to-date, with net buying of around $32 billion in the S&P 500 alone this month ($23 billion just last week).
However, this wave of buying momentum appears to have ended. Flood pointed out this is the first time in over a month that CTAs are no longer net buyers of the S&P 500—slightly tilting towards selling amid calm markets, and likely providing more significant supply pressure if markets move downward. This means that the largest and most consistent marginal buyer has now "fully loaded," and the market has lost a key automatic stabilizer.
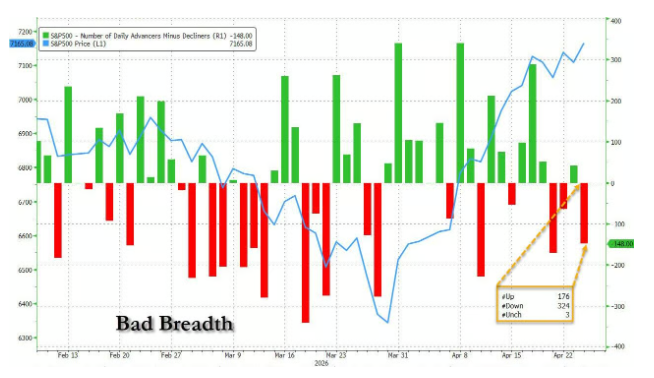
Signal Four: Market Breadth Severely Worsening, Hidden Risks Behind New Highs
The fourth signal exposes structural risks beneath the surface boom. Last Friday, the S&P 500 hit a new all-time closing high, but market breadth that day marked the second worst ever on a day of record highs: 324 constituents declined, with net breadth reading -148. The only worse instance was in October 2025, when 80% of S&P 500 constituents fell on a record high day.
The severe divergence in market breadth means that this rally is highly concentrated in a few heavyweight stocks, while overall market participation has shrunk dramatically. Historically, such structures often precede high-level volatility or corrections.
Signal Five: Sentiment Indicators Enter “Stretched” Range, Semiconductor Surge Raises Caution
The fifth signal comes from the Goldman Sachs US Equity Sentiment Index: investor positioning now shows “stretched” characteristics. From the overall sentiment framework, positioning remains relatively elevated.
Meanwhile, Flood specifically highlighted the extreme trends in the semiconductor sector. The Philadelphia Semiconductor Index (SOX) has been up for 18 consecutive trading days, marking the longest rally in history. As of Friday's close, it was about 50% above its 200-day moving average—the most extreme level since the 2000 bubble peak (when SOX once traded over 100% above its 200-day average). This performance reflects growing market confidence in the linkage between AI computing power consumption and revenue generation, as well as new concerns about AI ecosystem capacity constraints.
In the derivatives market, S&P 500 gamma positioning is in a rare zone, with market makers extremely net short gamma on spot price breakouts—meaning that any directional price move will likely trigger magnified volatility. Nearly no professional investors are currently holding outright long positions, with July call option implied volatility trading near just 12, making upside trades still a “lonely” bet.
Although these five warning signals point to a short-term retracement, Goldman Sachs still believes the S&P 500 will close 2026 significantly higher than current levels, and any pullback should be seen as a structural buying opportunity. Historically, since the financial crisis, whenever the S&P 500 has returned to previous highs after a >10% correction, average returns over the following 1 week, 1 month, and 3 months have been 1.5%, 5.2%, and 8.6%, respectively.
Disclaimer: The content of this article solely reflects the author's opinion and does not represent the platform in any capacity. This article is not intended to serve as a reference for making investment decisions.
You may also like
Has the U.S. stock market short-term short covering come to an end?
Bitcoin climbs above $79,000, Asian equities rise amid 'subdued' geopolitical tensions
SK Hynix, average bonus of $900,000?