
It's not unusual for stocks and oil to rise together—AI has just accelerated the process.

Oil prices have surged, so why hasn’t the stock market continued to fall as it did in the past?
According to Chasewind Trading Desk, on May 7, Citi’s Global Macro Strategy team released its latest research report to interpret this puzzling market phenomenon: This is not an anomaly—AI has changed the rhythm.
This round of oil price shock began on March 6
Analysts have marked the starting point of this round of the oil price shock as March 6, 2026.
The criteria are clear: Brent crude oil futures rise more than 40% in three months, and the average cumulative increase in the next 100 trading days is still positive—this is the definition of a “persistent oil price shock.”
Historically, every time such a significant and persistent oil price hike occurred, cross-asset markets would experience a fixed transmission logic: oil price rises→interest rates increase→financial conditions tighten→stock market comes under pressure.
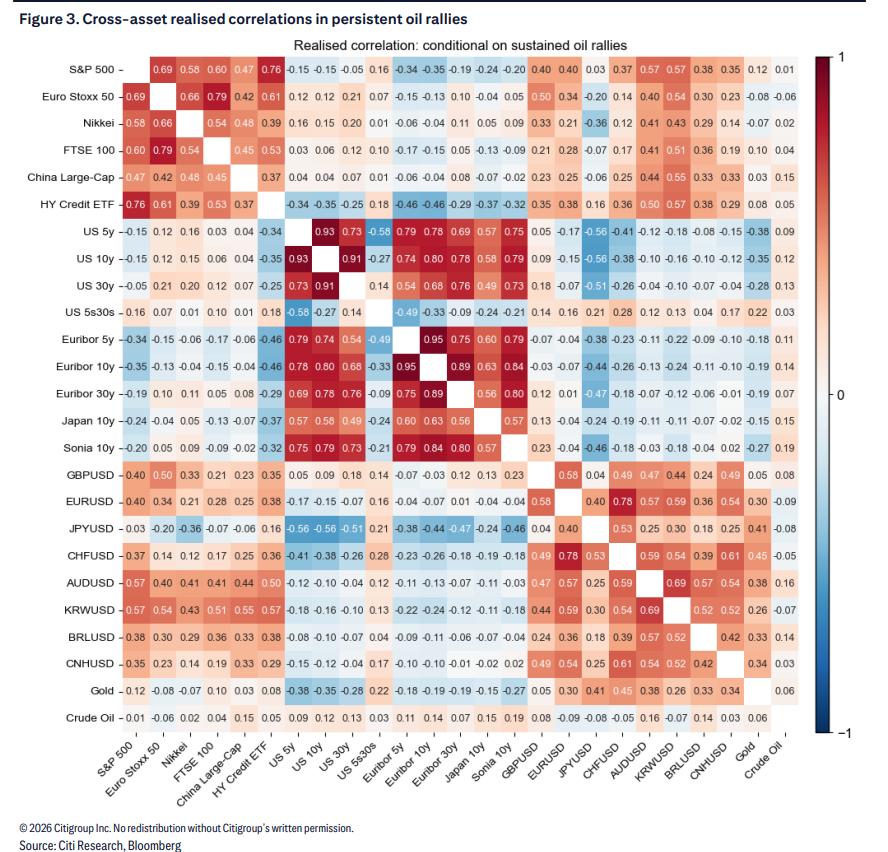
Data shows that in previous persistent oil price shocks, U.S. stocks generally continued to decline for about 50 days at first, before entering a bottoming-out phase.
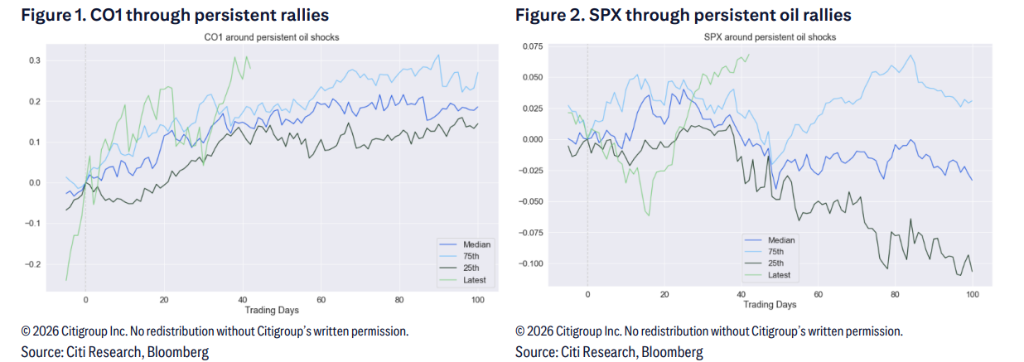
What's different this time: Stocks fell quickly and rebounded even faster
Historically, it took about 50 days for the stock market to bottom after a fall, but this time it's clearly different.
Oil prices continued to rise, but after a sharp decline, the U.S. stock market rebounded much faster than historical averages. The report notes:
The speed of bottoming this time is faster than before, due to AI optimism.
Specifically, hyperscalers are leading the S&P 500 higher. The market’s reaction to tech earnings supports this— as long as increased AI capital expenditure translates to higher revenue, investors are willing to buy in.
Therefore, even if oil prices rise again, the S&P 500 can continue to climb. The AI theme is strong enough to support tech stocks as leaders, even with persistently high oil prices.
History tells us: After oil prices remain high, stock-oil correlation reverses
This is the core finding of the report.
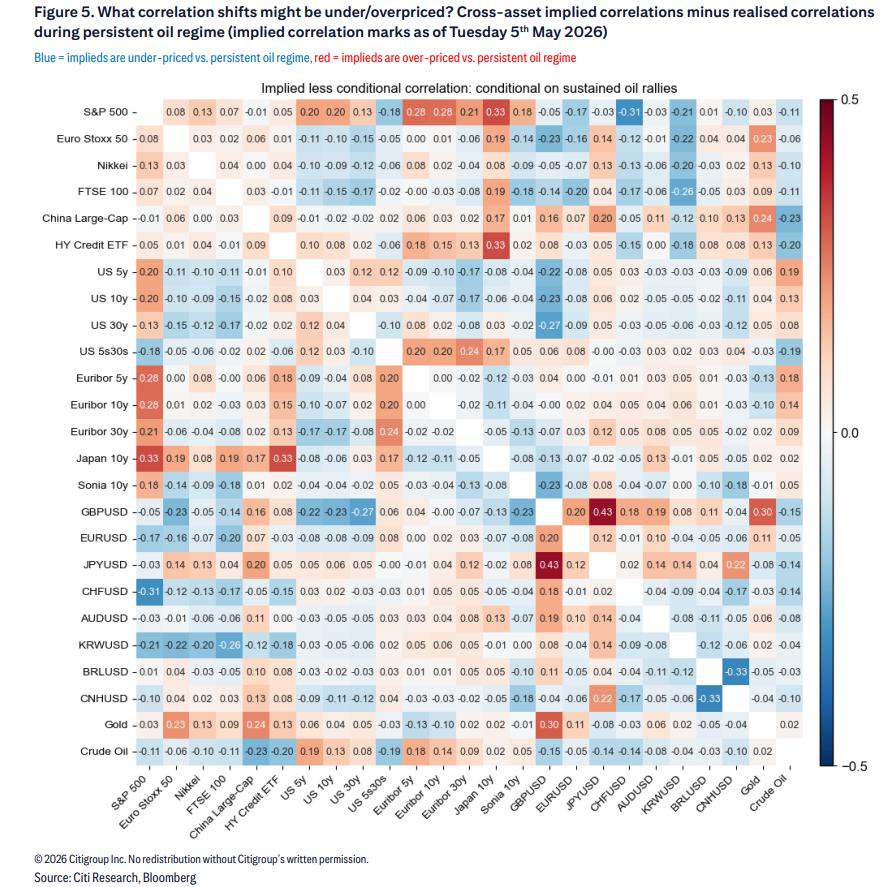
Analysts reviewed all historical cross-asset correlation data during periods of “persistent oil price shocks” and reached one key conclusion:
In the initial stages of an oil price shock, stocks and oil are negatively correlated (oil up, stocks down); but as the shock continues, this negative correlation fades, and can even become mildly positive (stocks and oil both rise).
The logic is not complicated: the greatest damage from the oil price shock is concentrated in the early phase—rapidly rising rates, suddenly tightened financial conditions, and the stock market forced to digest it. Once this “digestive period” passes, the market gradually “sees through” oil prices, and risk assets reprice.
The data also shows, during sustained high oil price stages:
-
The correlation between global stocks and U.S. Treasury yields shifts from negative to positive (this holds for European, Japanese, and Chinese stocks as well)
-
The positive correlation between U.S. Treasury yields and oil prices weakens significantly
-
The correlation between the U.S. Treasury yield curve (5s30s spread) and oil prices also turns from negative to positive—that is, the curve shifts from bear flattener to normalization
Market mispricing appears, Citi identifies a trading opportunity
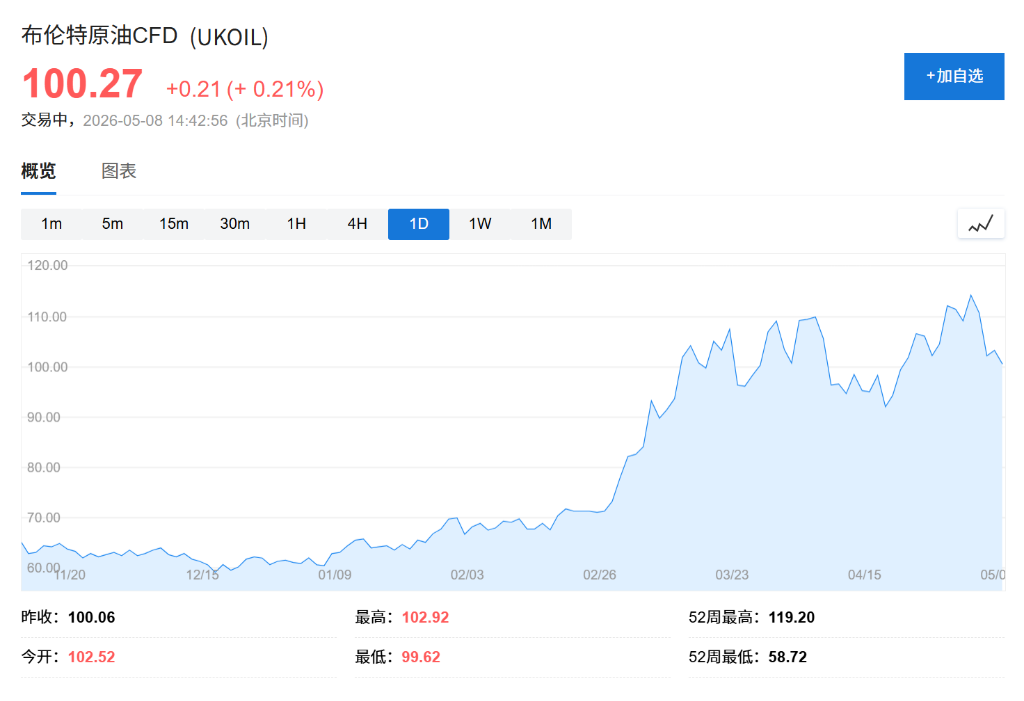
Analysts compared the “expected correlation” historically with the currently implied market correlation and found significant pricing deviations.
Three major mispricings:
1. Stock-oil correlation is underestimated The current market-implied 6-month stock-oil correlation is -10%, meaning the market is still betting on “oil up, stocks down.” But analysts believe historical patterns show this negative correlation will fade or even reverse, and thus current pricing is clearly too low.
2. Correlation between U.S. Treasury curve (5s30s) and oil price is underestimated The market implies a negative correlation, but historical data shows as the oil shock persists, this turns positive.
3. The correlation between high yield bonds (HYG) and interest rates is overestimated The quant macro team points out that in more severe stagflation scenarios, credit spreads are usually the first risk asset to “break down.” The market is already pricing in the negative correlation between HYG and oil prices, which is relatively sufficient.
Betting on “stocks and oil rising together”
Based on the above, Citi has established a new trading position:
Buy Dual Digital options expiring August 17, 2026: S&P 500 above 106.25% (i.e. 7,833.29 points) AND crude oil futures CLU6 above 110% (i.e. $91.19/barrel), premium is 7.5% of notional, notional $2 million, max loss $150,000.
Reference price: S&P 500 spot at 7,372.50, CLU6 crude oil futures $82.90/barrel (pricing time: May 7, 2026, London time 14:43).
The logic is straightforward: if the stock-oil correlation turns positive as per historical patterns, then the probability of “stocks and oil rising together” is underestimated, so Dual Digital option pricing is relatively cheap.
Citi also indicates it prefers to express this theme via “S&P 500 rising + oil prices rising” rather than directly trading the curve’s correlation with oil—because it is more confident about the U.S. stock market going up than the steepening of the Treasury curve.
Notably, the report also explicitly warns of risks: “The main risk of this trade is the persistence of the negative correlation between oil prices and the S&P 500.”
Strait of Hormuz: the structural support for high oil prices
The fundamental logic behind the “long-term high oil prices” lies in the Strait of Hormuz. Even if negotiations make progress, upside risk remains in oil prices:
-
If the strait remains closed, global oil inventories will continue to decline, which will create convex shocks to oil prices
-
Even if the strait gradually reopens, it will take time to restore inventories to normal, and the market supply will remain tight
-
Therefore, “even if an agreement is reached, the substantial risk of persistently high oil prices remains”
This is also the premise of the analysts' framework: oil prices will not fall back quickly, so historical patterns of cross-asset correlations are still worth referencing.
~~~~~~~~~~~~~~~~~~~~~~~~
Disclaimer: The content of this article solely reflects the author's opinion and does not represent the platform in any capacity. This article is not intended to serve as a reference for making investment decisions.
You may also like
“TACO” is outdated, Wall Street is flooding into “NACHO” trades!
DXY: NFP-driven upside likely measured – MUFG

ZKL (zkLink) fluctuates 41.6% within 24 hours: Low liquidity amplifies price swings, no clear event-driven factors