How has the US stock market performed during each Federal Reserve leadership transition?

On May 15, Powell officially stepped down as Chairman of the Federal Reserve, with Waller taking the oath and succeeding him. For the markets, the core focus is: with the change of leadership at the Federal Reserve, how will U.S. stocks perform?
In its latest report, Huafu Securities points out that investors should be wary of the illusion of calm in the "first month after the leadership transition." Historical experience shows that in the first month after a new Fed chair takes office, U.S. stocks are usually stable, even slightly outperforming the historical average.
However, the real market changes often emerge 3 to 6 months after the transition. As the new policy framework is gradually priced in by the market, the average maximum retracement for U.S. stocks over a three-month and six-month period reaches -10.13% and -13.14%, respectively, with mid-term volatility risks rising significantly.
Meanwhile, the shift in policy style is reshaping the logic for asset pricing. In his confirmation hearing, Waller made it clear that he would abandon the "over-communication" forward guidance framework from the Bernanke, Yellen, and Powell eras. This means the Fed will no longer act as the market’s "protector," and asset prices will become highly sensitive to economic data and policy meeting decisions.
In terms of operations, Waller plans to introduce trimmed mean PCE as a new measure of inflation, and due to the current system size of around $3 trillion in reserves, he may actively decelerate the pace of balance sheet reduction (QT). For investors, the coming half year requires preparation for higher expected volatility and more dramatic asset repricing.
The “honeymoon period” at the start of the transition and the “volatility amplifier” in the medium term
Historical data indicates that a change in Federal Reserve chair brings a clear pattern of "limited short-term impact and amplified medium-term volatility" to the U.S. stock market. The market often worries excessively about the uncertainty of new policies, but experience since 1970 reveals a counterintuitive phenomenon: in the first month following a leadership change, U.S. stocks are not turbulent but are instead in a relatively safe “observation period.”
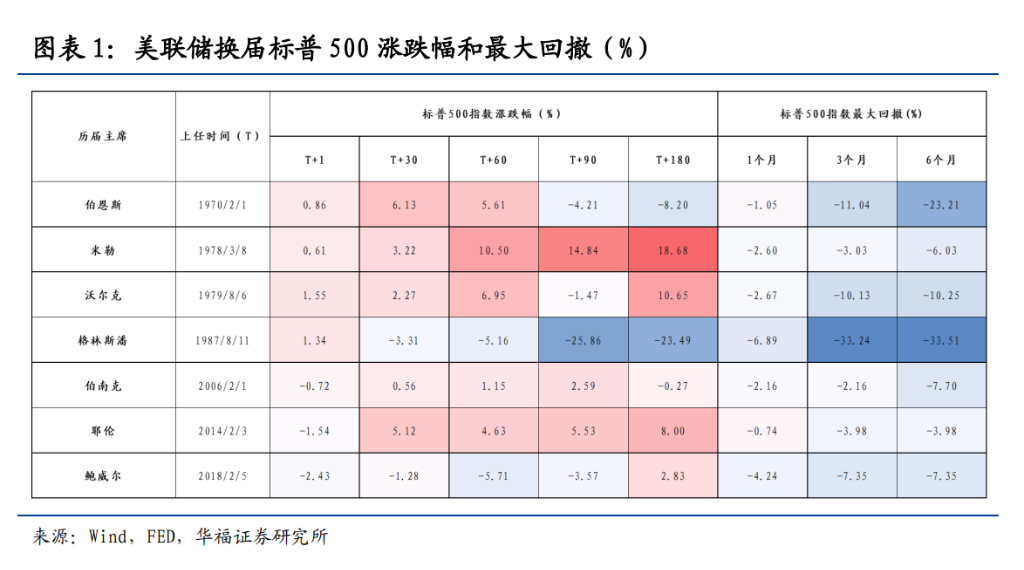
Specifically, in the first month after the transition, the average return of the S&P 500 is 1.81%, significantly higher than the overall historical average of 0.80%; the average maximum drawdown is only -2.91%, outperforming the historical average of -3.95%. This is mainly because the new chairman tends to maintain the predecessor’s policy framework or communication style in the early days, providing the market with short-term certainty.
However, real risks begin to surface in the process of medium-term pricing. As new FOMC policy paths, changes in economic data, and the actual impact of the new chair’s communication style take effect, U.S. stocks will enter a pronounced volatility window:
-
Three-month horizon: The average S&P 500 return drops from the normal historical +2.28% to -1.74%; average maximum drawdown expands to -10.13%, deepening by 2.92 percentage points compared to the historical norm.
-
Six-month horizon: The average increase further narrows to 1.17%, far below the normal historical +4.63%; average maximum drawdown deepens to -13.14%.
In summary, the impact of a change in the Fed chair on U.S. stocks is not an immediate shock, but a progressively deepening process. Investors should remain highly alert to volatility risks over the three- to six-month horizon beneath the illusion of early calm during a transition.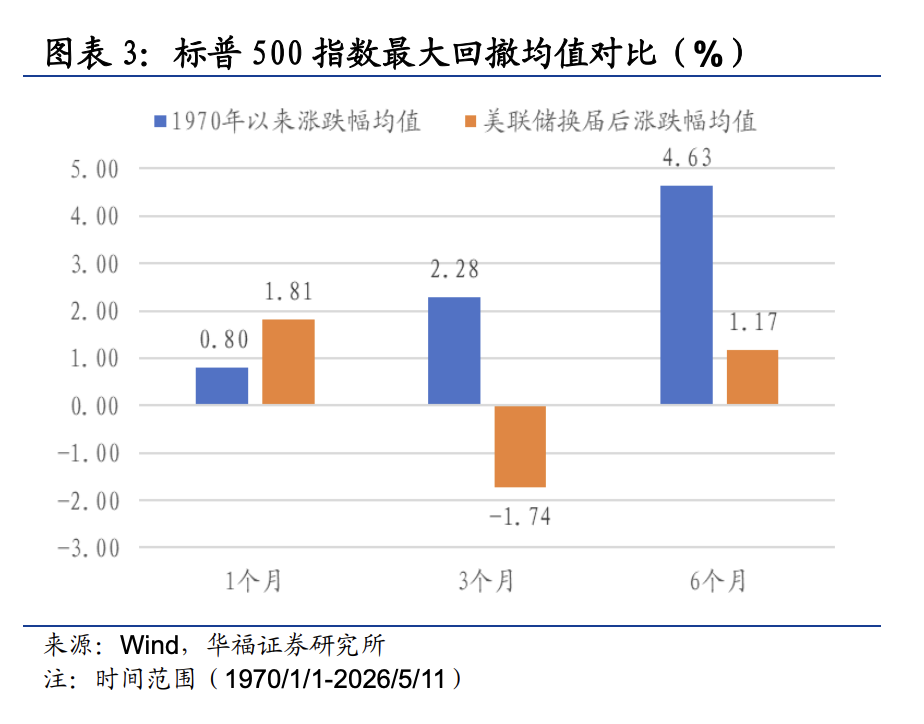
Historical Review: Macro Cycles and Policy Continuity Determine Market Fate
Looking back since 1970, the ultimate direction of the market after each Fed leadership change has not been determined by the "personnel shift" itself, but rather by the prevailing inflation level, valuation, and whether the new chair continues the existing policy framework. The macro environment at the time of each transition is the key variable determining the intensity of market volatility.
-
Political Compromise and Stagflation Risks (1970 Burns, 1978 Miller)
When Burns took office, U.S. inflation was soaring (CPI at about 6.2%), unemployment at 4%, and under Nixon's political pressure, he cut the effective federal funds rate from 5.75% to 3.25%, sparking the short-lived “Nifty Fifty” boom but destroying inflation expectations and laying the groundwork for later stagflation.
When Miller succeeded him, U.S. stocks rose 18.68% over six months, but this rebound was built on the false prosperity of negative real rates, and inflation was never tamed. By the time Miller took office, inflation was higher and climbing, but he still failed to tighten policy, causing inflation expectations to spiral further out of control.
- Aggressive Tightening and Valuation Killers (1979 Volcker, 1987 Greenspan)
Facing runaway inflation, Volcker shocked rates up near 20%, leading to a six-month maximum equity drawdown of -10.25%. But the short-term pain paid off, with CPI eventually tamed to the 3%-4% range.
When Greenspan first took office, he continued the tightening stance; paired with expensive U.S. stock valuations and widespread program trading, this triggered "Black Monday"—within his first 60 days, markets saw a maximum drawdown of -5.16%. This forced an immediate pivot, cutting rates from 7% to 5.5% in the short term to stabilize markets.
- Orderly Transitions and Policy Continuity (2006 Bernanke, 2014 Yellen, 2018 Powell)
Bernanke took over with a fundamentally sound economy, continuing rate hikes, with a three-month maximum drawdown of only -2.16%. When Yellen took office, CPI was just 1.1%, and the Fed maintained zero interest rates, with a cumulative 8% gain in 180 days as the market steadily recovered. Powell picked up the baton late in a hiking cycle, raising interest rates four times up to 2.25%-2.5% in 2018 amid trade tensions, putting notable pressure on markets early in his tenure.
Historical experience shows that what truly determines market trends are the cycle positioning and policy choices behind the transition, not the transition itself.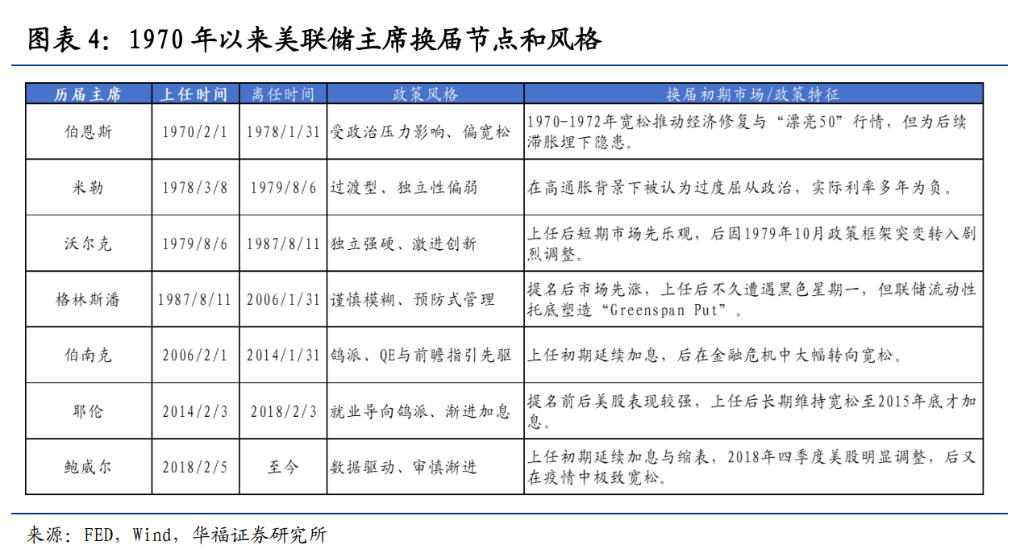
Waller’s Policy Blueprint: Reshaping the Inflation Narrative and Ending “Over-Communication”
If Waller leads the Federal Reserve, he may reshape central bank communications, reduce forward guidance, and leverage “trimmed mean PCE” statistics and the AI productivity narrative to create policy space for rate cuts.
In his Senate testimony, Waller exhibited reflection and reform sensitivity, pointing to the 2021-2022 inflation surge as a major policy mistake. Operationally, markets should closely monitor adjustments to his communication mechanisms. Waller has made it clear he opposes pre-disclosing rate paths, viewing “over-communication” as a constraint on policy flexibility. This means the expectation management model, in place since the Bernanke, Yellen, and Powell eras for almost fifteen years, may be coming to an end. Without the buffer of forward guidance, risk assets will respond more sharply to economic data and FOMC outcomes.
On the rationale for rate cuts, Waller has not promised aggressive easing but has outlined two potential pillars for dovish policy:
-
The AI Productivity Narrative: Suggests that the efficiency gains from artificial intelligence can underpin the rationale for rate cuts in the long run.
-
A New Inflation Measurement Framework: Specifically mentions the Dallas Fed’s “Trimmed Mean PCE”—excluding the lower 24% and upper 31% weights. Under current tariff and selective commodity shocks, this indicator is significantly lower than core PCE. If its weight in policy decisions rises, the Fed can construct a narrative that "underlying inflation has receded," creating space for policy easing.
Regarding balance sheet reduction, Waller favors advancing this in collaboration with the Treasury, slowly and prudently. But current liquidity conditions do not support aggressive action. Banks’ reserves are around $3 trillion, but the ONRRP buffer is shrinking. During the 2017-2019 QT cycle, when reserves fell to about $1.4 trillion, the repo market crisis was triggered. Given current tougher regulation and greater endogenous reserve demand, the room to further reduce liquidity is limited. Therefore, the balance sheet reduction under Waller is likely to proceed more “slowly, shallower, and later” as a compromise path.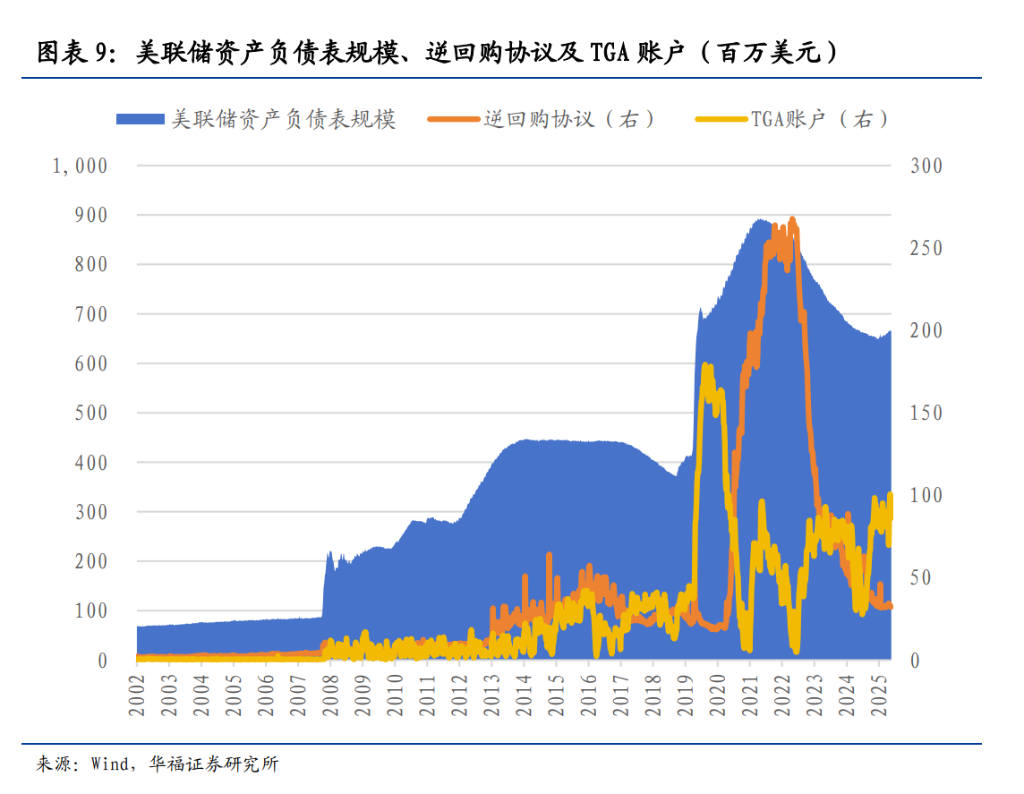
Disclaimer: The content of this article solely reflects the author's opinion and does not represent the platform in any capacity. This article is not intended to serve as a reference for making investment decisions.
You may also like
Making money is getting harder even for Canada Goose
Silver Price Forecast: XAG/USD drops 8% as hawkish Fed expectations pressure metals