Bulls and bears battle over crude oil at the 100 mark, while the bond market quietly deals a blow to global assets

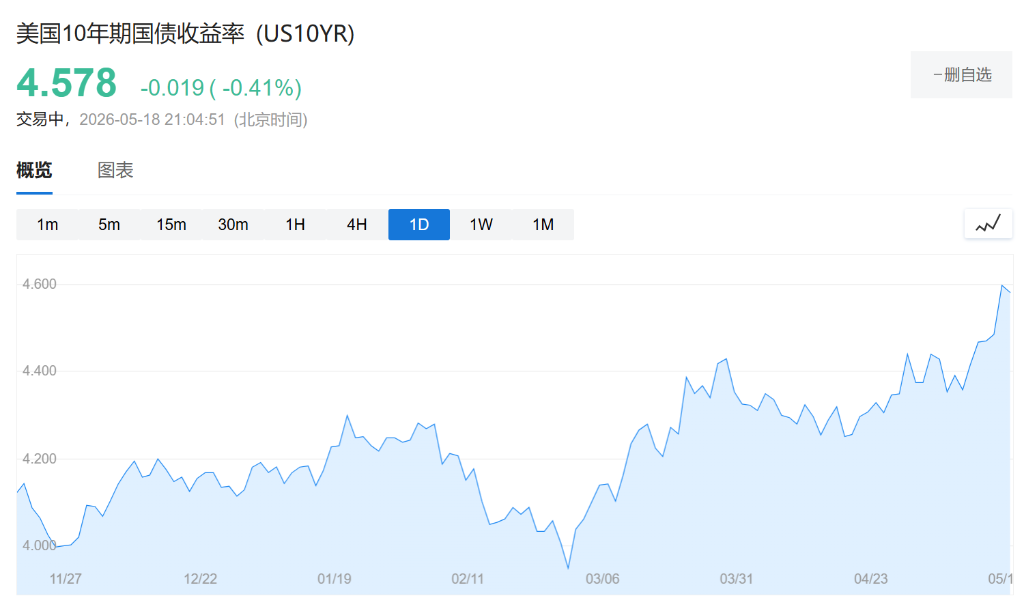
汇通网 May 18 News—— On Monday, May 18, the global financial markets showed a clear divergence in trends. Today, the global bond market became the market focus, with the eurozone benchmark German 10-year Bund yield hitting a 15-year high, while the US 10-year Treasury yield also rose to its highest since February 2025. Japanese government bond yields climbed in tandem, reflecting the simultaneous adjustment of investor expectations for inflation risk and interest rates.
On Monday, May 18, the global financial market showed clear signs of divergence. The US dollar index remained strong, the 10-year US Treasury yield continued to hit new highs for the cycle, driving significant sell-off pressure in the global bond market. Due to Middle East tensions, crude oil prices reached a two-week high, while gold saw only a minor rebound from a one-and-a-half-month low, remaining under overall pressure in a high-yield environment. Data show that a simultaneous rise in the dollar and Treasury yields has severely constrained non-yielding assets, while crude oil is dominated by geopolitical factors and exhibits pronounced high-level oscillations.
Today, the global bond market became the market focal point, with the eurozone's German 10-year Bund yield touching a 15-year high, and the US 10-year Treasury yield hitting its highest since February 2025. Japanese government bond yields rose in sync, reflecting investor adjustments to both inflation risk and rate expectations.
Global Bond Market Sell-off and Upward Pressure on Yields
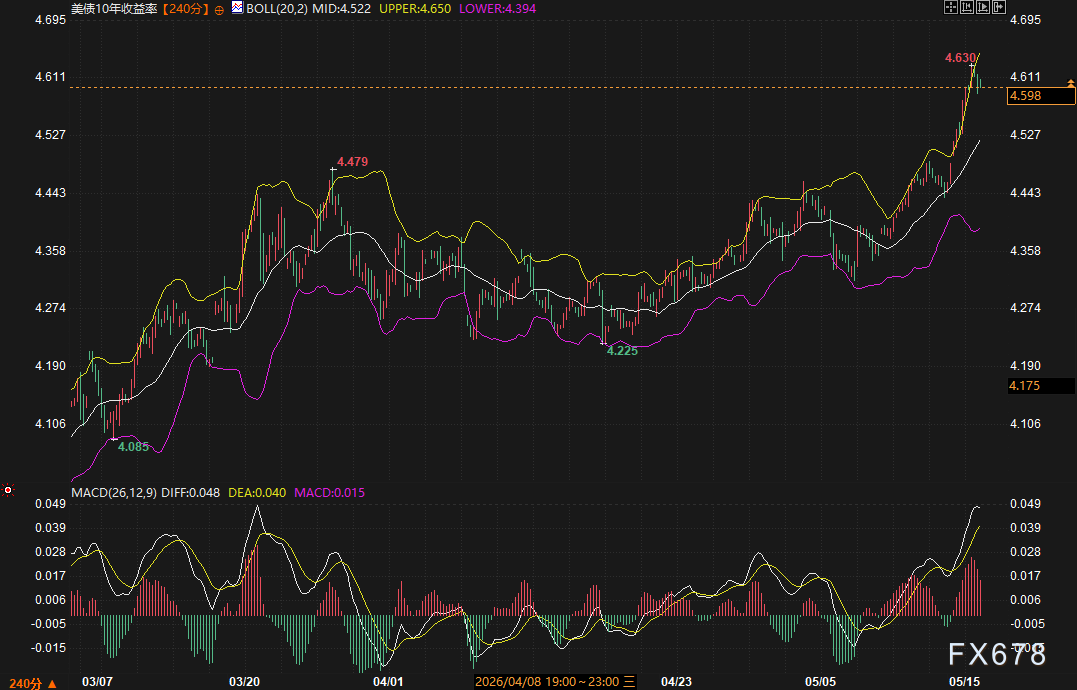
The global bond market continued to adjust today, with eurozone bond yields rising significantly. The German 10-year Bund yield touched a new 15-year high, up 2.5 basis points from the previous trading day, to 3.1796%. Italy's 10-year yield also climbed to around 3.973%. This trend is mirrored in the US and Japan bond markets, with the US 10-year Treasury yield breaking above its upper band and setting a new cycle high, now reporting at 4.598, indicating strong bullish momentum.
From a technical perspective, the 10-year US Treasury yield's Bollinger band shows the upper band at 4.650, the lower at 4.394, and the middle at 4.522; the price has already breached the upper band and continues to reach new highs. The MACD indicator shows that both DIFF and DEA are rising above the zero axis, with expanding red bars, indicating a clear uptrend with ample momentum. Since the late-April low of 4.225, yields have been accelerating upward. On the fundamental side, instability in the Middle East has pushed energy prices higher, fueled inflation expectations, and heightened market concerns over the path of global central bank rates—becoming the main driver of bond market adjustments. In the short term, the 4.60%-4.63% range forms initial resistance; a valid breakout could test even higher levels.
US Dollar Index Strength and Its Spillover Effects
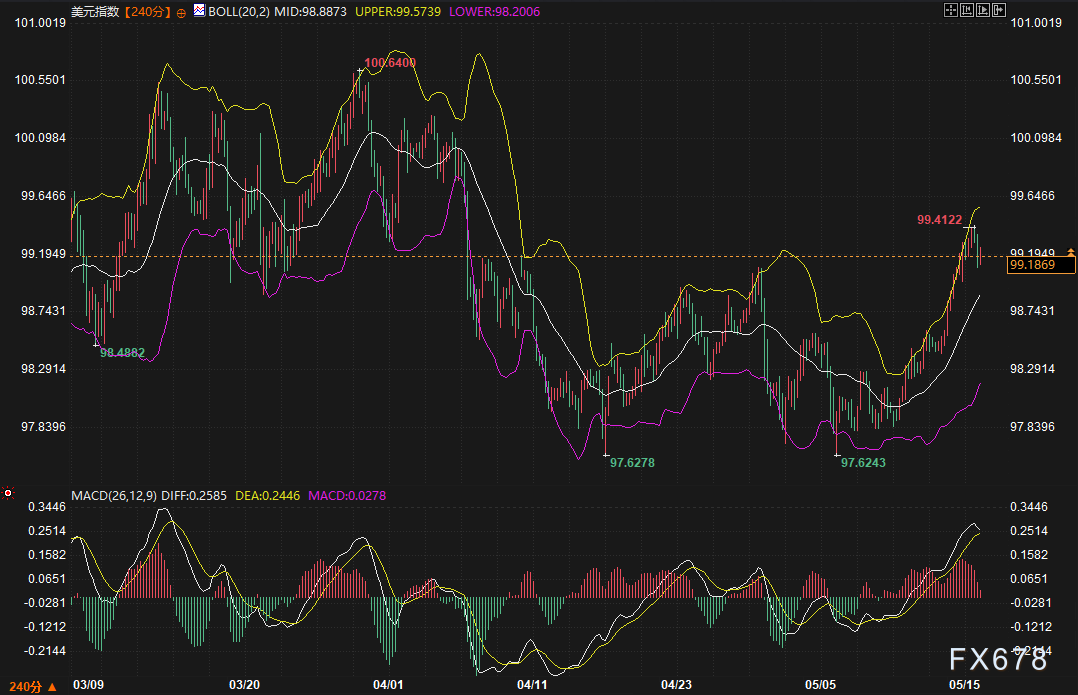
The current US dollar index stands at 99.1869, above the Bollinger middle band at 98.8873 and close to the upper band at 99.5739, moving along a strong trajectory. The MACD indicator shows both lines rising above the zero axis, with shrinking, but still positive, red bars—indicating a sustained bullish trend. The candlestick chart shows a one-sided upward trend since early May, breaking through several resistance levels.
This strength resonates with rising US Treasury yields, directly suppressing gold and similar assets. In logic, as the attractiveness of US dollar assets rises, capital flows support the simultaneous rise of the dollar and yields. In the short term, the upper band near 99.57 is a key resistance, with the middle band around 98.89 providing initial support. If prices hold above the middle band, the short-term bullish pattern for the dollar is expected to persist.
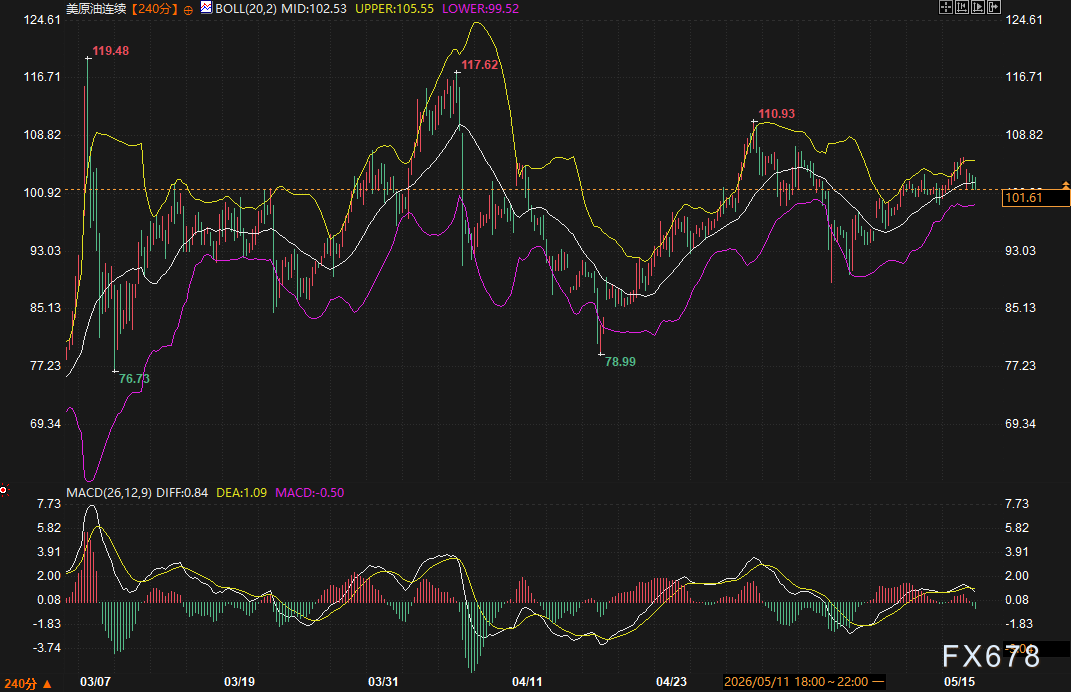
Crude Oil High-Level Volatility and Geopolitical Supply-Demand Dynamics
US crude oil for continuous contracts is currently quoted at 101.61, below the Bollinger middle band at 102.53, oscillating in the lower-middle range. The MACD indicator shows a death cross near the zero axis, with a small green bar emerging, meaning short-term bullish momentum is weakening. On the candlestick side, after probing lower in mid-April, oil rebounded and fell back from the early-May high; now high-level volatility is apparent, with intensified bulls vs. bears.
Fundamentally, crude oil is moving largely on independent drivers, mainly Middle East tensions. Brent crude once rose above $110/barrel. Recent data show that heightened geopolitical strains have raised shipping channel risks and accelerated the drawdown of commercial oil inventories. On the technical side, the lower band near 99.52 is key support, while the middle band around 102.53 is the short-term oscillation core. Supply-demand and macro sentiment are intertwined; direction is still pending further confirmation, but the prevailing high-level oscillation is expected to persist.
Gold Under Pressure: Adjustment and Technical Support Test
Spot gold is now quoted at 4541.90, with the Bollinger middle band at 4616.61 and the lower band at 4472.55. Price has broken below the middle band and is nearing lower band support; the latest low of 4480.52 is close to this band. The MACD indicator shows continued decline below the zero axis, with expanding green bars—signaling strong bearish momentum. Candlestick charts have formed a double-top, followed by consecutive declines, showing a clear medium-term downward trend.
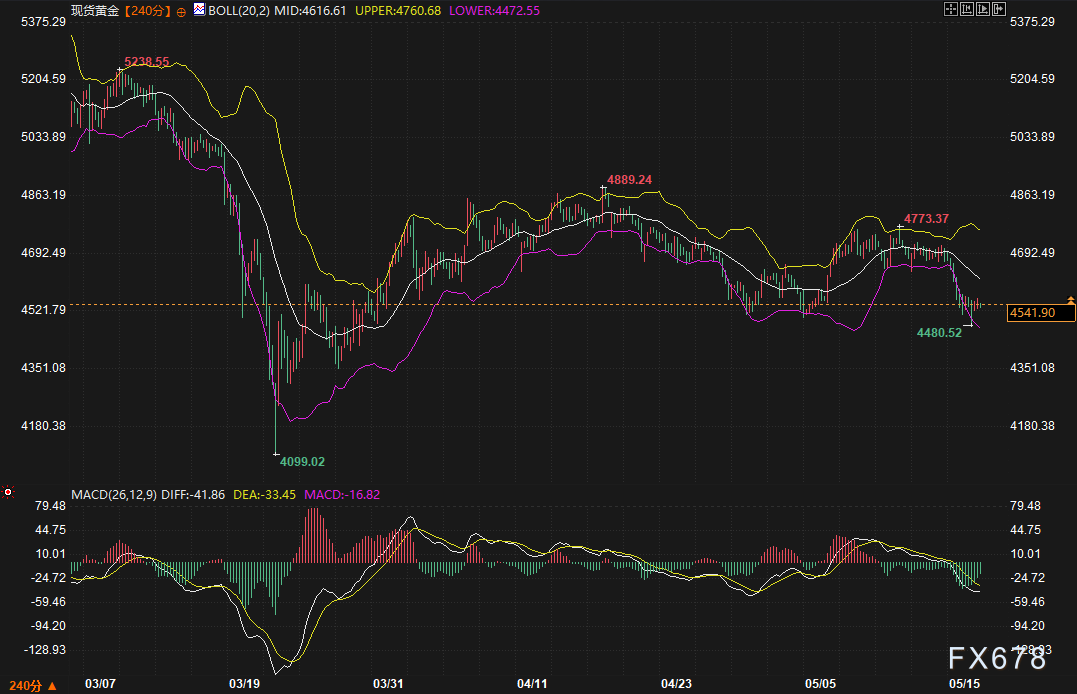
Although today saw a slight rebound from a one-and-a-half-month low, the high-yield environment and strong US dollar form a dual constraint. On the fundamental side, expectations for “higher for longer” rates are weakening the appeal of non-yielding assets, though geopolitical safety flows offer some support. Technically, the lower band near 4472 is key support, with the middle band near 4616 as a rebound barrier. With prices close to the lower band, there may be a technical rebound in the short term, but overall, gold remains under pressure.
Trend Outlook
Over the next 2-3 days, the rhythm of global bond market adjustments will be key. If US yields consolidate in the 4.58%-4.63% range, the dollar’s strength could stabilize for a period, which may ease downward pressure on gold, though rebound potential is limited; crude oil will continue to be dominated by Middle Eastern developments, with supply-demand changes at the margin worth monitoring during high-level volatility.
Logic suggests the resonance between the dollar and yields will likely continue to suppress gold, while crude oil will retain relative independence. Overall, the market remains at the intersection of geopolitical and macro policy expectations. It is important to closely track this week’s PMI data, which will help validate inflation expectations. For the short term, oscillation within ranges and trend confirmation will coexist, with support and resistance zones serving as the central focus for operational decisions.
Frequently Asked Questions
How significant is the spillover effect from the global bond market sell-off to other assets?
The global bond market adjustment today is mainly due to elevated energy prices and inflation expectations spurred by developments in the Middle East. Higher yields directly boost the attractiveness of US dollar assets, suppressing non-yielding assets like gold. Data shows that after the US Treasury yield broke its technical ceiling, the linked effect has appeared as a divergence between gold and the US dollar. This transmission is likely to continue in the short term, though a technical pullback in yields could bring a temporary easing of cross-market pressure.
How effective is the current lower band support for gold?
Technical data shows that gold prices are near the lower Bollinger band at 4472.55, with the previous low of 4480.52 close to this area. Although bearish momentum is strong, “technical oversold” features have emerged, and together with geopolitical safe-haven factors, a short-term bottoming rebound is possible. However, in an environment where both the dollar and yields are strengthening simultaneously, the lower band support will face repeated tests, and the middle band near 4616 forms notable rebound resistance.
What are the break conditions for crude oil to leave its high-level range?
Crude oil is currently oscillating in the lower-middle range of the Bollinger bands, between 101 and 103. Progress in the Middle East, geopolitical risk premium shifts, and inventory data will be key to breaking range conditions. If shipping channel risk remains high, prices could easily retest previous highs; conversely, if tensions ease temporarily, a retest of the lower band support at 99.52 is possible. The bull-bear struggle intensifies, and short-term direction is still unclear.
Can the US dollar index maintain its current strength?
The US dollar index is near the upper Bollinger band, with the MACD bullish signal persisting and a clear one-sided uptrend in the K-line. Though speculative long positions in the dollar have shrunk somewhat, the overall strong channel remains unbroken. The middle band at 98.89 is key support, while the upper band near 99.57 is resistance. If US Treasury yields remain elevated over the next 2-3 days, the dollar’s bullish trend may continue.
What is the potential market impact of this week’s key economic data?
This week, PMI data from the eurozone and UK, consumer confidence, and Germany's Ifo survey will be in focus. These data will test whether inflation is passing into the real economy and shape central bank rate expectations. If cost-push pressure is evident, bond yields may stay high, continuing to suppress gold; conversely, if growth concerns increase, selling pressure may partially ease. Crude oil will remain primarily driven by geopolitical events, with macro data serving as supplementary confirmation.
Disclaimer: The content of this article solely reflects the author's opinion and does not represent the platform in any capacity. This article is not intended to serve as a reference for making investment decisions.
You may also like
BGSC fluctuates 89.3% in 24 hours: Token burn effect drives severe price volatility
HIVE stock rallies 35% after unveiling 320MW 'AI gigafactory' project in Toronto
Morning Minute: Bitcoin Slides Back to $77K on Rising Bond Yields, Oil Spike