
Four Broad US Dollar Liquidity Indicators: Assessing the "Life" and "Death" of Risk Assets [Cheng Tan Masterclass 4.2]


Preview of Highlights
Many people, upon seeing the VIX surge, high-yield bond spreads widen, and a sharp rise in the US dollar, their first reaction is to panic sell.
However, historical data shows us: in most cases, liquidity shocks are actually signals to increase positions.
March 2020, August 2024, April 2025, March 2026—among these four shocks, three bottomed out quickly after a two-standard-deviation move.
Only the 2008 financial crisis and the aggressive rate hikes in 2022 were truly "sustained pain."
What's the difference?
The former was a combination of the real estate sector collapse and continually broken expectations, while the latter was the Federal Reserve's delayed and forceful catch-up after lagging behind the curve.
In this session, Tanku Macro founder Cheng Tan will systematically break down:
What is “broad dollar liquidity”?
Why are the dollar exchange rate, real interest rates, high-yield bond spreads, and the VIX the four most crucial macro liquidity indicators?
And how to use the OFR Financial Conditions Index to determine if it’s "time to panic" or "time to be greedy"?
Disclaimer: The content of this article solely reflects the author's opinion and does not represent the platform in any capacity. This article is not intended to serve as a reference for making investment decisions.
You may also like
Swedish Krona: SEK resilience under Iran risk – Commerzbank
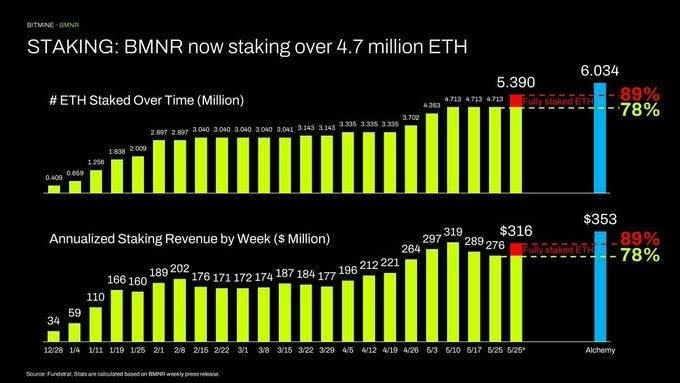
Bitmine's ETH Holdings Reach Near 5% of Total Supply
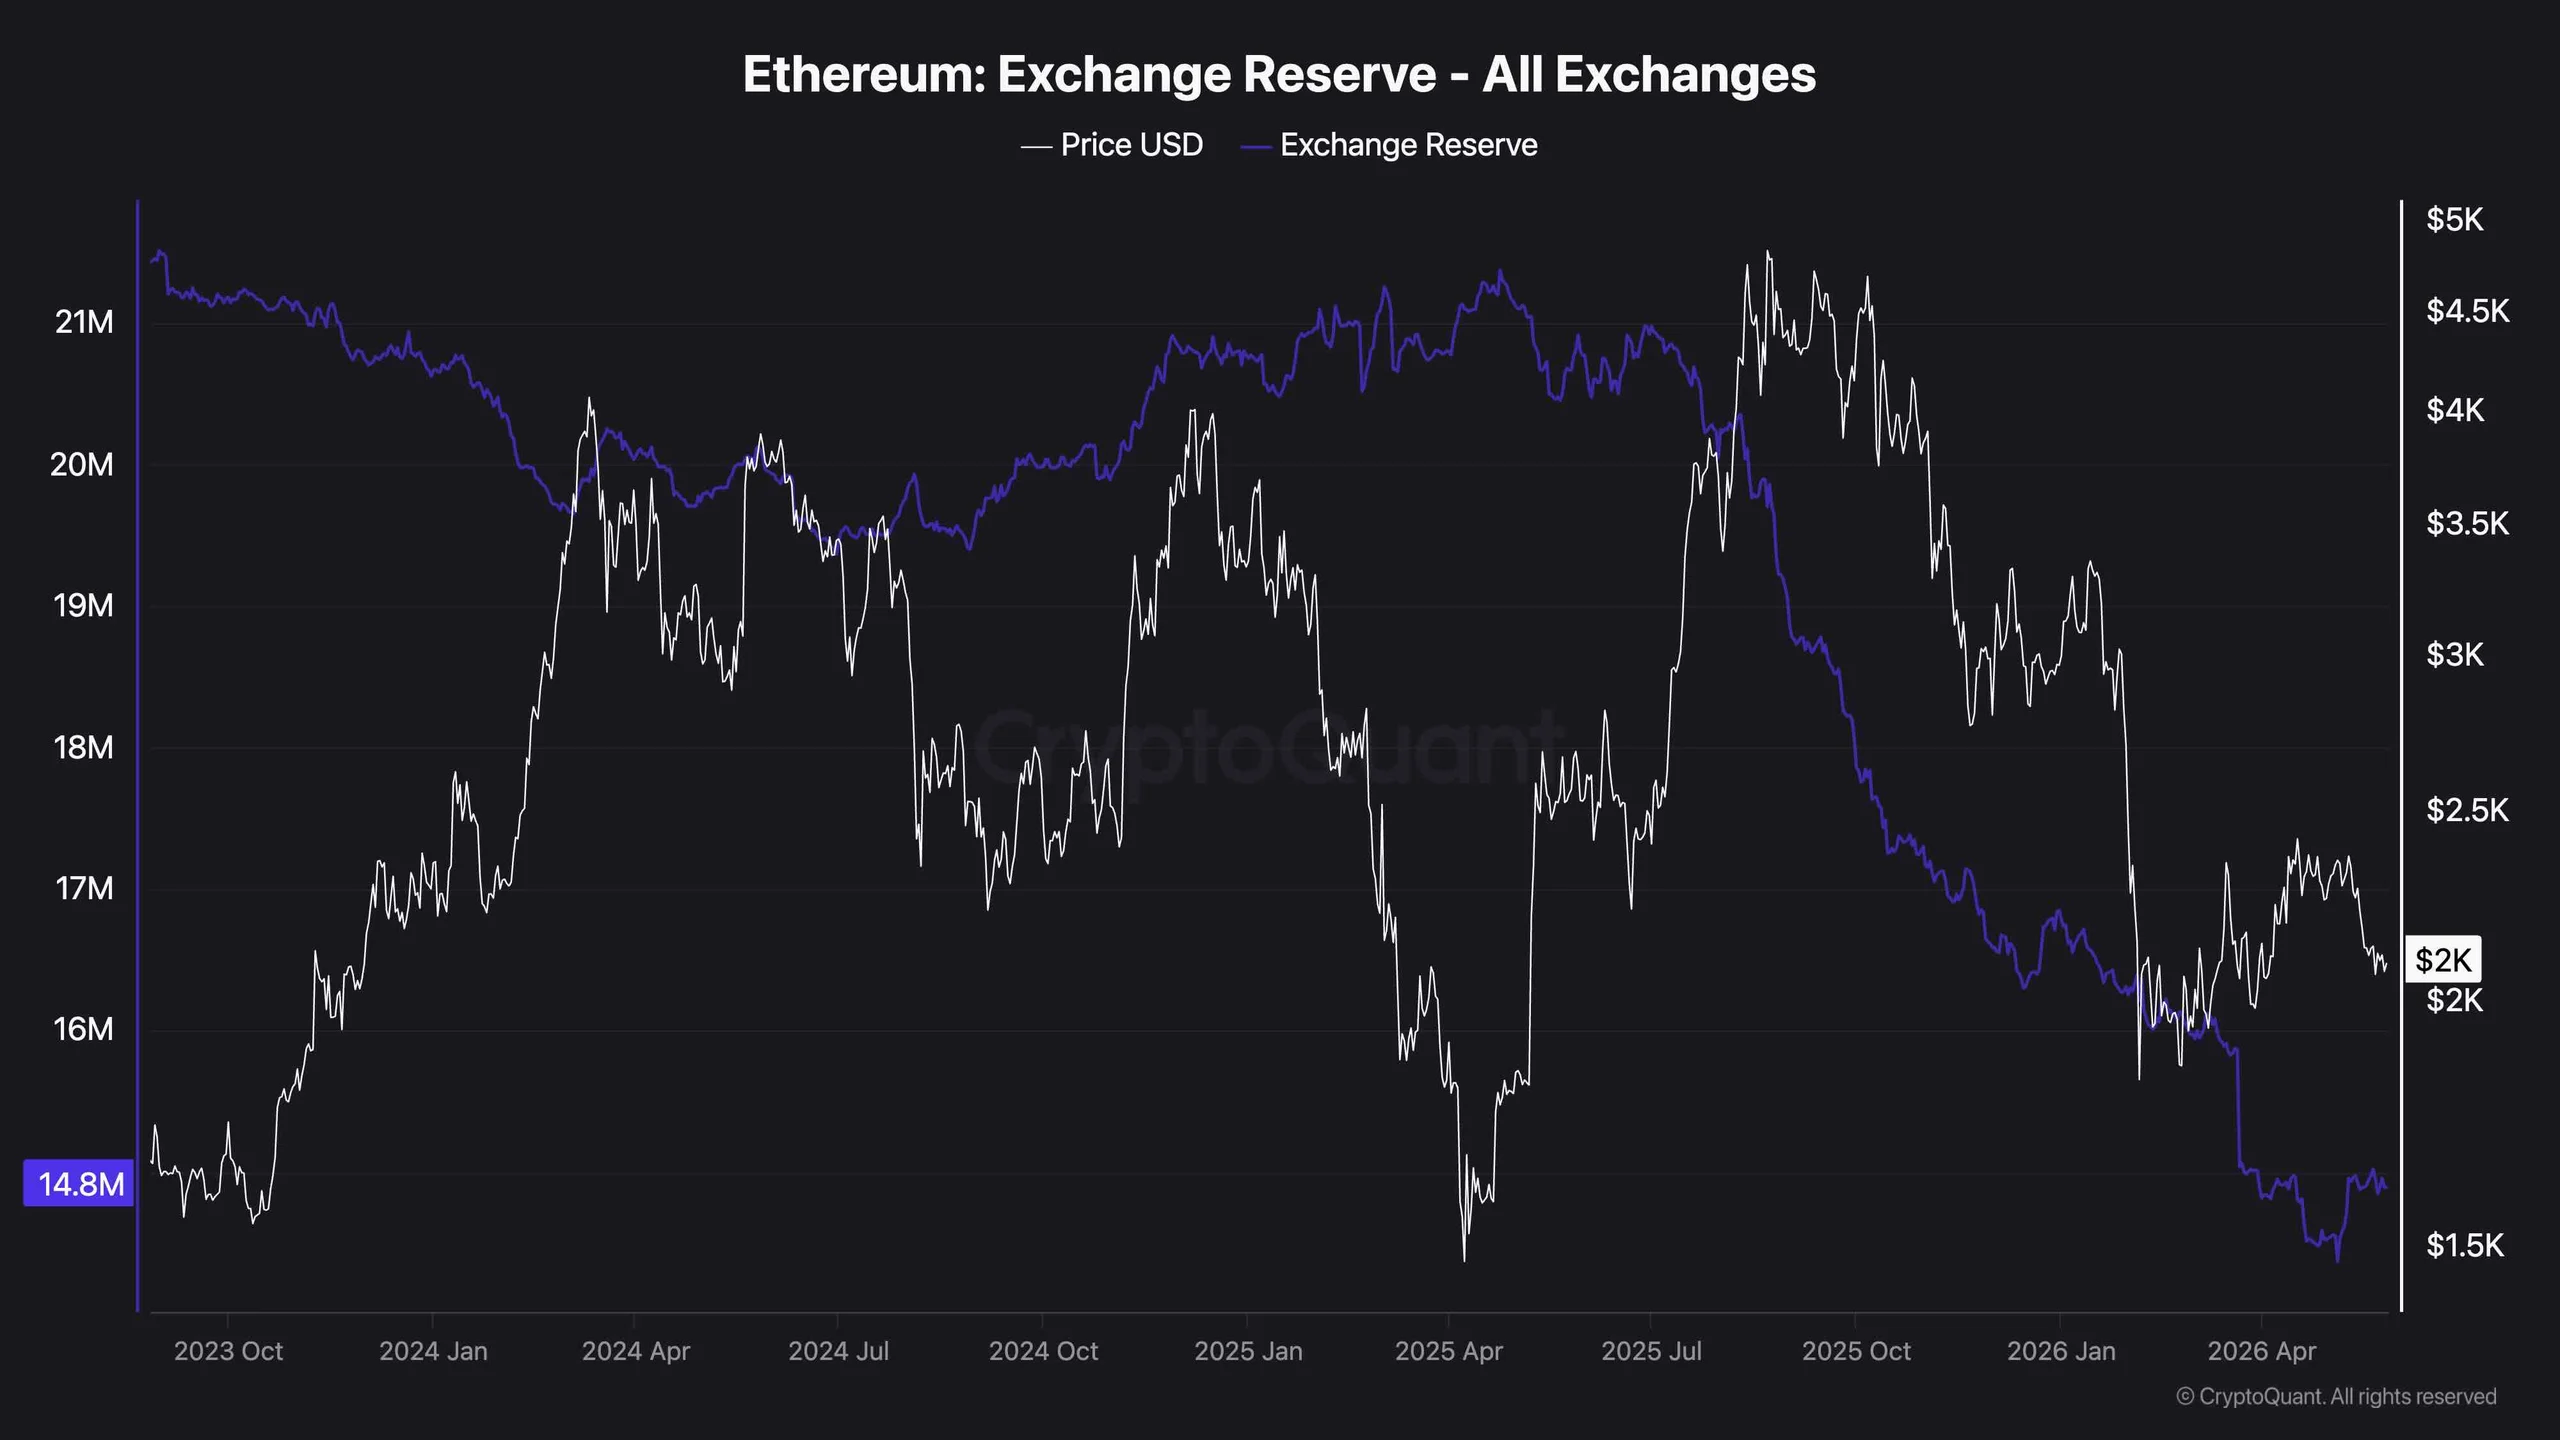
Ethereum Price Prediction: ETH Faces $1.8K Risk Unless Bulls Reclaim This Critical Level
$HYPE Hits New ATH With Strongest Spot Crypto ETF Debut in History — Key Unlock in Focus

Trending news
MoreCrypto prices
More





