
Crude oil enters a new pricing phase

The Hormuz crisis is not the starting point of a new long-term bull market in oil prices, but rather a re-pricing of risks following the loosening of the old pricing mechanism. Although it will bring about a short-term increase in the price center, ultimately, demand determines that high oil prices are difficult to sustain for the long term.
The relatively stable crude oil pricing system that has operated for decades is now facing dual shocks from both the physical and institutional sides. The Hormuz Strait crisis caused by the US-Israel-Iran conflict has weakened market confidence in the uninterrupted flow of key energy routes. The withdrawal of the UAE from the oil alliance has exposed declining internal coordination within the organization. The combination of these two factors means that the current volatility in oil prices cannot be explained solely by short-term geopolitical risk premiums; the crude oil pricing mechanism itself may require recalibration.
1. Two Historical “Gear Shifts” in Oil Prices
Looking back at the crude oil market since 1946, global oil prices have experienced two rounds of structural upward shifts in the price center, each corresponding to a change in the pricing mechanism.
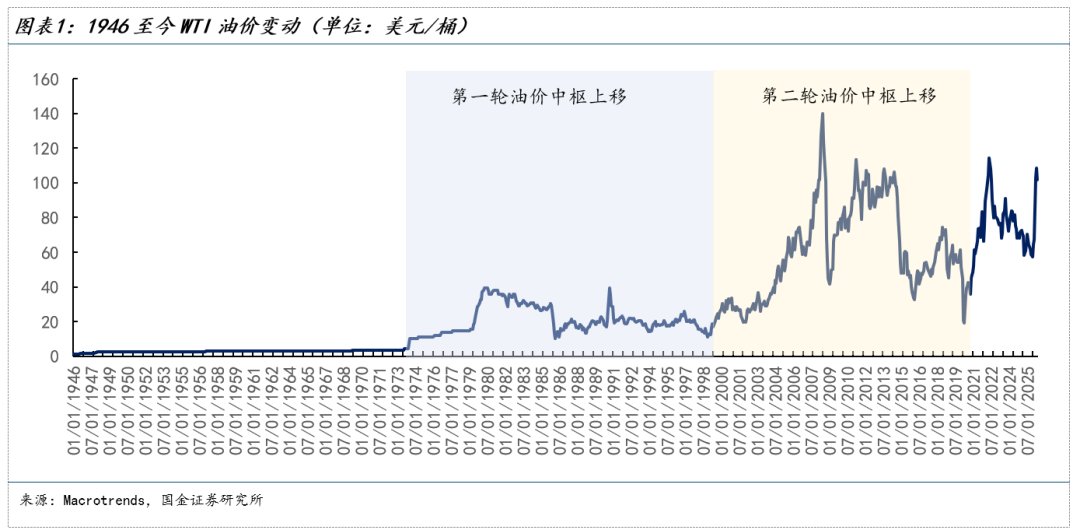
The first upward shift occurred after the 1973 oil crisis, as a result of transferring pricing power, bargaining power, and a currency system revaluation.
Prior to 1973, international oil prices were predominantly controlled by the Western oil giants—the “Seven Sisters”—and oil-producing countries played a more passive role in pricing and profit-sharing arrangements. Following the oil crisis, OPEC broke this low-price system through embargoes, production cuts, and collective price increases, resulting in a shift of crude oil pricing power from multinational oil companies to resource-rich producing countries. Prices began to reflect resource scarcity and producers' bargaining power, rather than simply ensuring stable supply for consumers and profits for Western companies.
In 1971, the Texas Railroad Commission abolished production quotas, and after domestic production peaked at about 9.6 million barrels per day in 1970 and began to decline, the role of marginal production regulator shifted from the United States to Saudi Arabia—thus, consumer countries lost the ability to stabilize international oil prices through their own production, and the bargaining balance tipped toward resource countries.
At the same time, following the collapse of the Bretton Woods system and the continued devaluation of the US dollar, dollar-priced oil required re-pricing. OPEC repeatedly raised benchmark prices to hedge against declining dollar purchasing power, pushing oil prices from around $3 per barrel to about $37 per barrel by 1981.
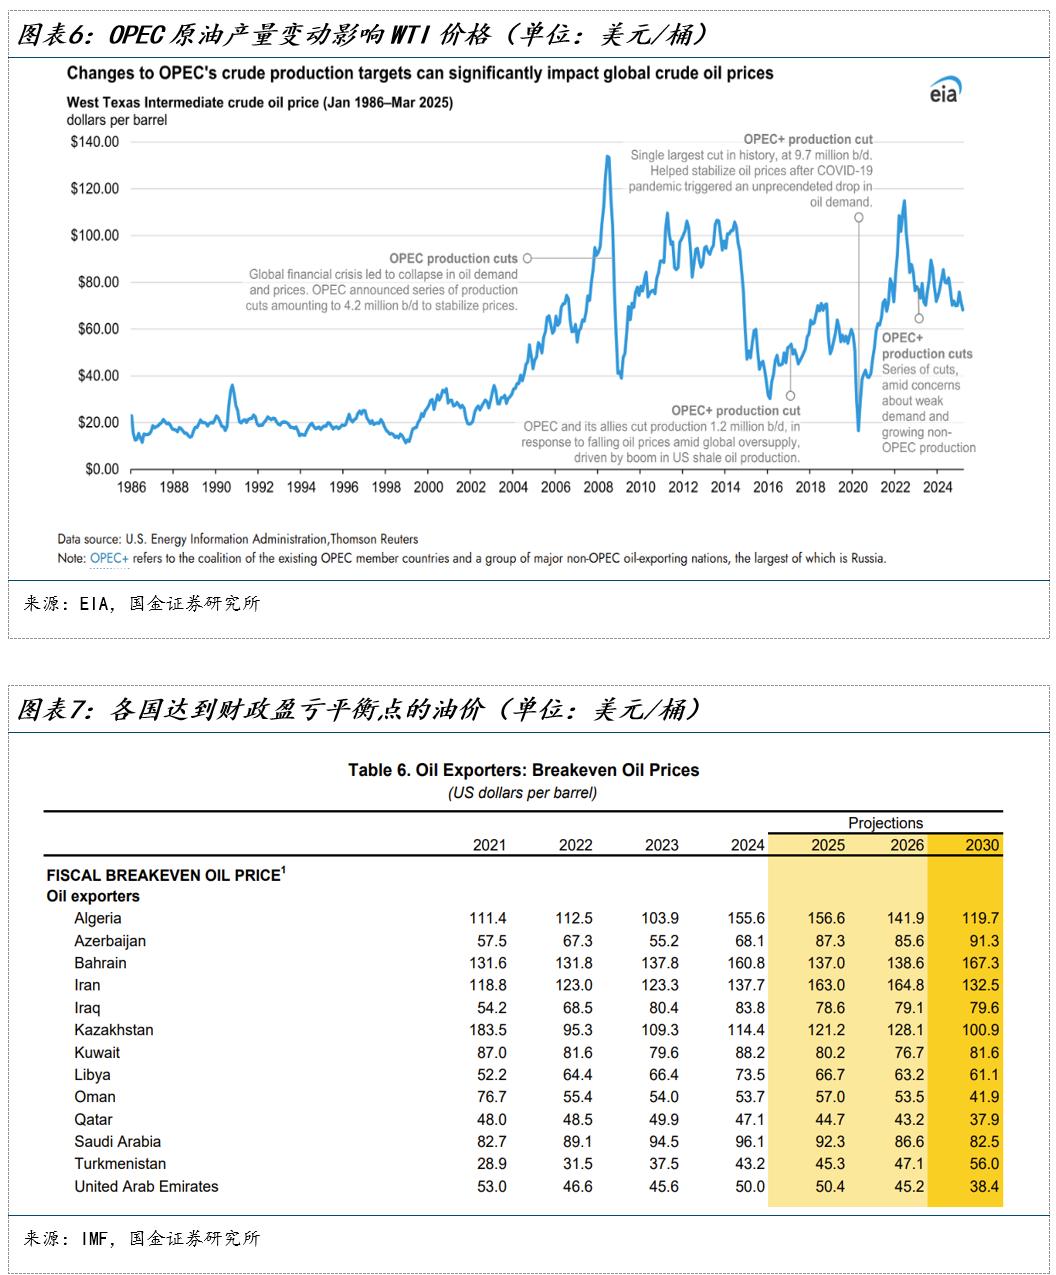
The core support for this upward shift was OPEC’s pricing power. In 1985, after Saudi Arabia abandoned its role as marginal production regulator and shifted toward competing for market share, oil prices fell from about $30 per barrel in 1985 to below $15 per barrel in 1986, and remained in a low range of $15–$25 per barrel for nearly 20 years thereafter (with a brief spike to nearly $40 during the 1990 Gulf War).
This reversely confirms that the high oil price center between 1973–1985 was primarily supported by the pricing mechanism, and when pricing power weakened, oil prices could fall back.
Entering the 21st century, oil prices experienced a second structural upward shift, driven mainly by demand-side expansion and a permanent rise in marginal supply costs.
Since 2000, global oil consumption has continued to shift towards Asia, with China becoming the main source of incremental oil demand growth. According to estimates by Columbia CGEP, from 2000 to 2023, China accounted for about 50% of the world’s oil demand growth.
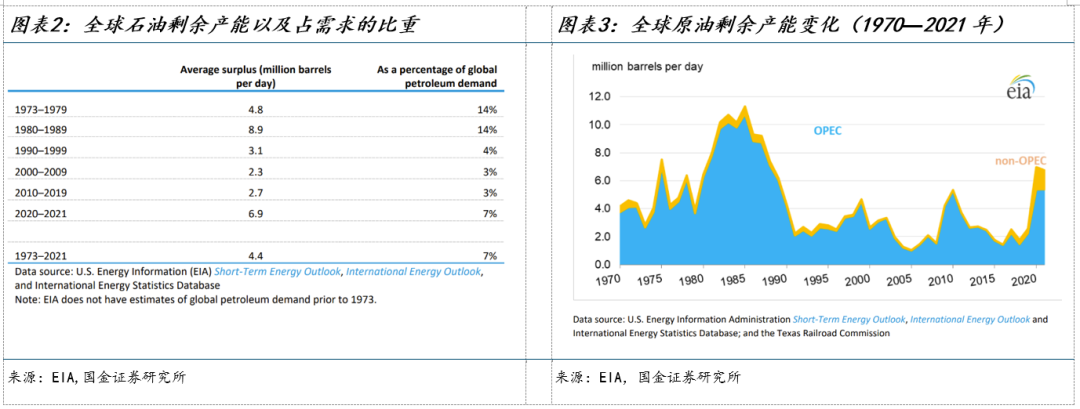
Changes on the supply side were also crucial. Global excess crude production capacity fell from 8.9 million barrels per day (about 14% of global demand) in the 1980s, to 3.1 million barrels per day (about 4%) in the 1990s, and further down to 2.3 million barrels per day (only about 3%) during 2000–2009. With excess capacity mainly concentrated in OPEC member countries, the fall in buffer capacity meant a marked weakening of OPEC’s ability as the global low-cost stabilizer.
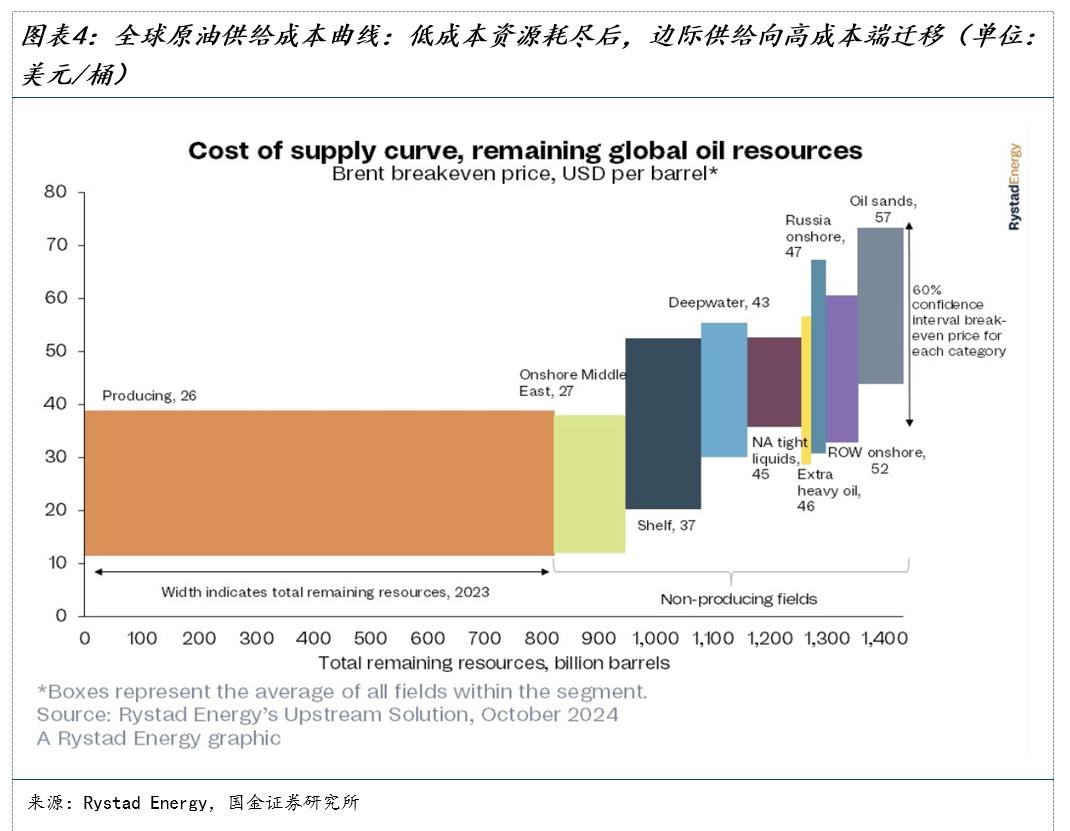
Meanwhile, traditional low-cost, non-OPEC resources also entered decline; new supply turned to US shale oil and other higher capital expenditure and longer development cycle resources. As demand growth outpaced low-cost production capacity expansion, the global marginal supply was forced towards high-cost sources, leading the market to price in a higher long-term equilibrium oil price and marginal supply cost.
The demand supercycle explains why oil prices soared; the rise in marginal cost explains why prices struggled to return to the low levels of the 1990s. Oil prices shifted from an annual average of $15–$20 per barrel in the 1990s to $50–$80 per barrel in the 2010s (occasionally exceeding $100 per barrel between 2011 and 2014).
2. The Long-Term Oil Pricing Mechanism is Loosening
After the second upward shift of the oil price center, the crude oil pricing mechanism gradually formed a relatively clear range framework: the lower bound is underpinned by OPEC+ policy support and the breakeven line for shale oil, while the upper bound is mainly determined by the short-cycle expansion resilience of US shale oil.
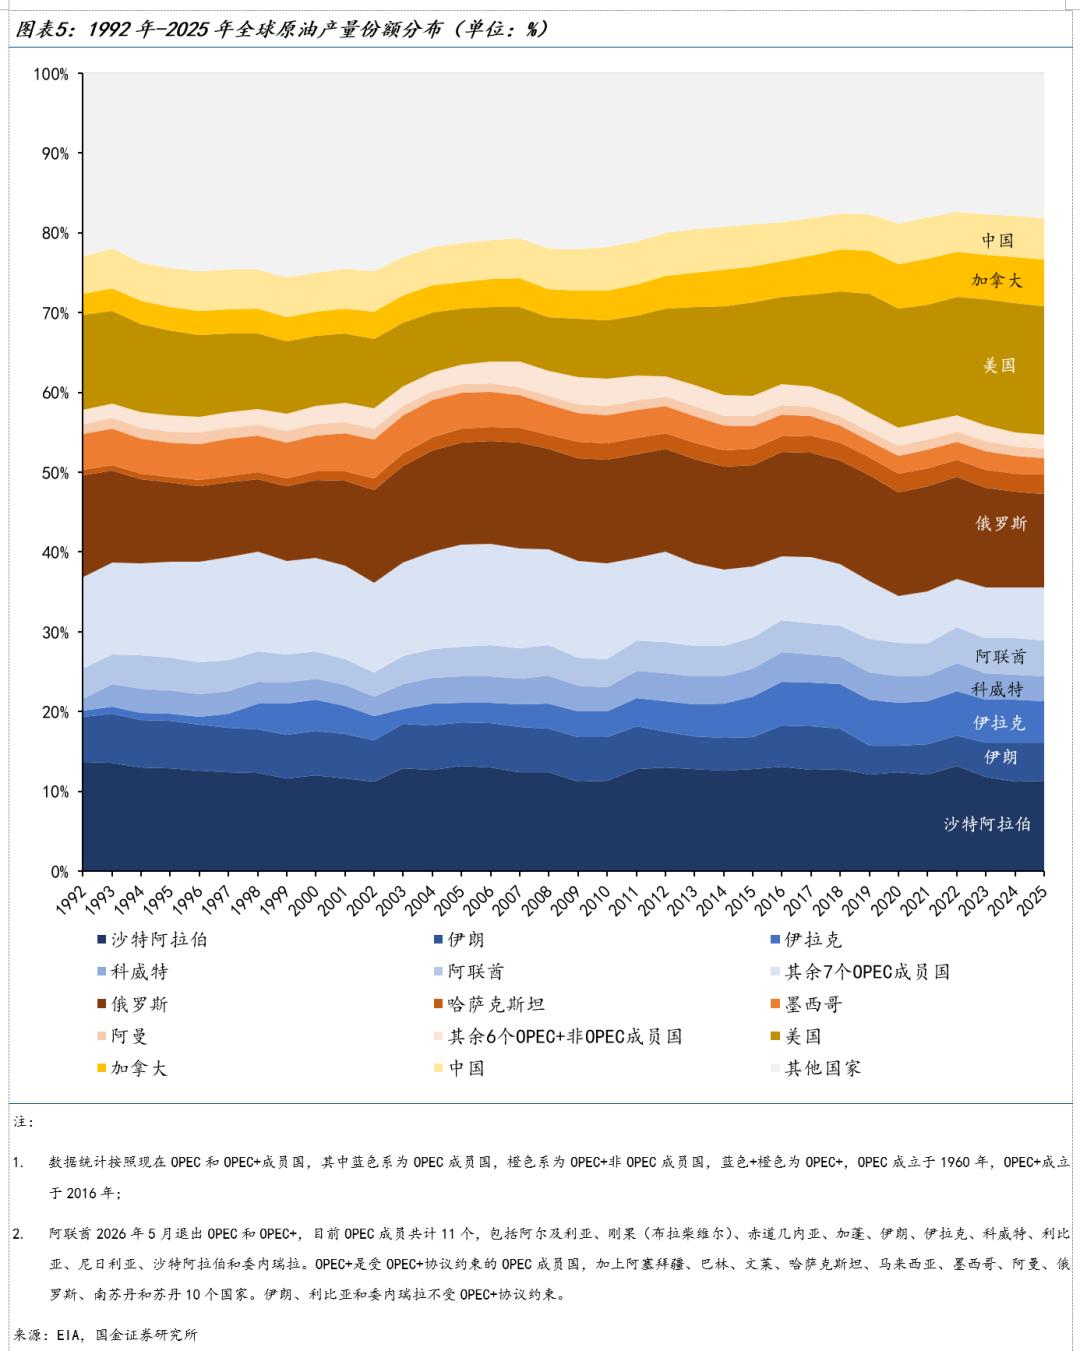
The supply-driven pricing in the global crude oil market depends mainly on both the United States and OPEC+. After the shale oil revolution, the US became one of the most important marginal suppliers of crude oil worldwide. At the end of 2016, OPEC and Russia established a joint production cut mechanism, and OPEC+ became an important influence on oil prices. The US is now the world's largest crude oil producer, accounting for 16% of global output in 2025, while OPEC+ members jointly account for 55%.
During low oil price phases, the lower bound is typically set by OPEC+ policy support and the cost constraints of shale oil. Gulf countries have lower extraction costs; some oil fields have strong capacity for production adjustment. But low costs do not mean producing countries are willing to accept low oil prices for long. Countries such as Saudi Arabia are highly dependent on oil exports for fiscal revenue. When oil prices fall to low levels, OPEC+ usually cuts production, extends cuts, or sends policy signals to stabilize market expectations, thereby underpinning oil prices. The establishment of OPEC+'s joint production cut mechanism in 2016, and large-scale cuts after the 2020 pandemic, illustrate this mechanism. The US shale oil breakeven line also serves as auxiliary support; when oil prices fall near new well development costs, shale companies lose expansion incentives, new supply slows, and cost support is provided to oil prices.
In high oil price phases, the upper bound is mainly constrained by demand’s absorption capacity and the US shale oil’s expansion capability. When oil prices stay high and downstream demand holds up, prices can remain elevated. But once high prices suppress consumption, refinery margins, and restocking appetite, demand contraction becomes a key constraint. Likewise, if high prices persist long enough, shale companies are more likely to ramp up capital spending, increase drilling, fracturing and completion, boosting supply and capping the upside for oil prices. Compared to traditional oil fields, shale oil investments have shorter cycles and faster production response, making US shale oil a crucial constraint during high price periods in the last cycle.
By contrast, OPEC+'s willingness to increase output in high price environments is unevenly distributed. In early 2022, pressured by high prices and external calls for more output, OPEC+ accelerated production increases, raising monthly targets for July and August to 648,000 barrels per day, above the previous 432,000. However, in October 2022, after oil prices fell from about $120 to around $90 per barrel, OPEC+ stopped increasing output and instead announced a 2 million barrel per day cut to targets.
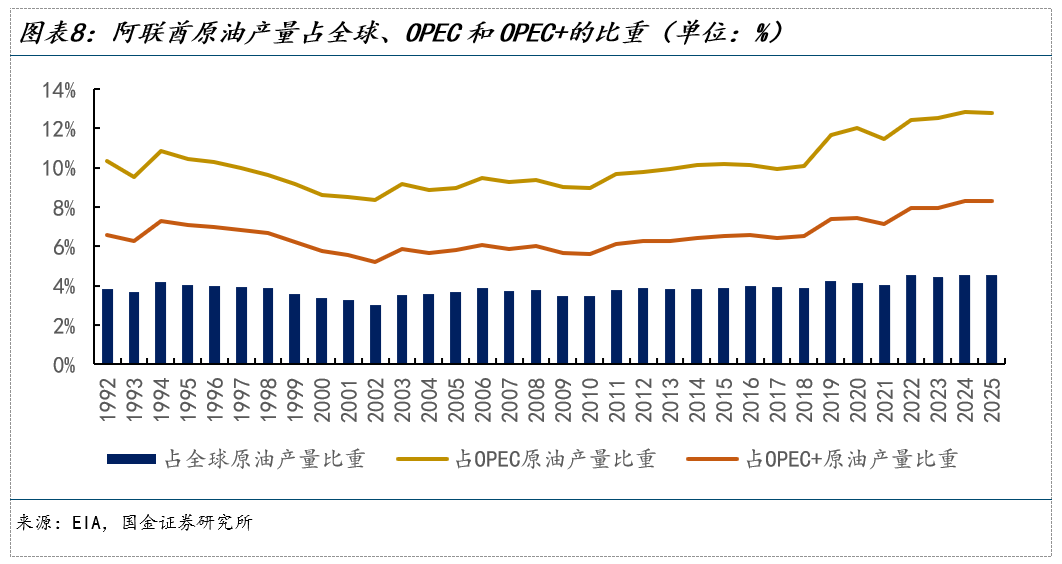
The constraint here lies in differing fiscal and capacity needs among OPEC+ members. Saudi Arabia is the core leader and owns most spare production capacity, but its fiscal breakeven price is high. In 2025, for Saudi Arabia, this price is about $92 per barrel, much higher than the UAE's $50. Members with higher fiscal pressure are more inclined to maintain high oil prices, while members with lower breakevens and spare expansion capacity are more motivated to pursue market share. This divergence makes it easier for OPEC+ to reach consensus on production cuts at low prices, but in high price phases, disputes over price support versus market share expansion are magnified, sowing the seeds for widened internal cracks.
However, the previously stable pricing mechanism in the crude oil market is being weakened.
First, Hormuz risk is changing the nature of geopolitical shocks from simply supply interruptions to a re-pricing of route credibility. Once route risk is priced in, it becomes not just a short-term supply shock, but a longer-lasting discount in trust.
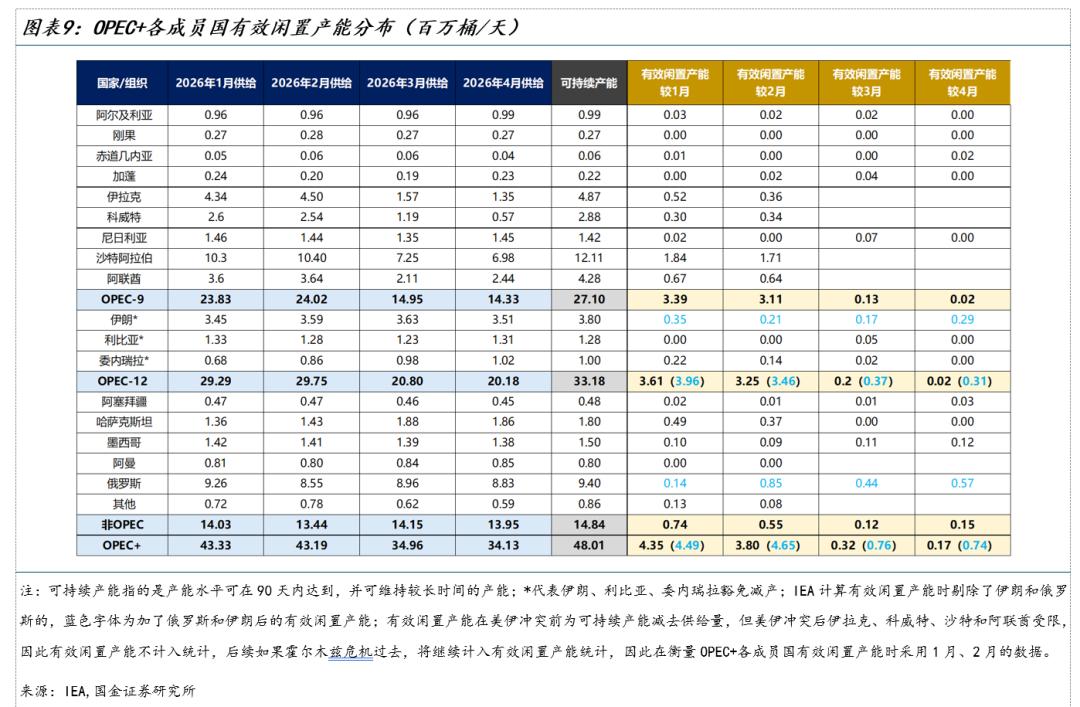
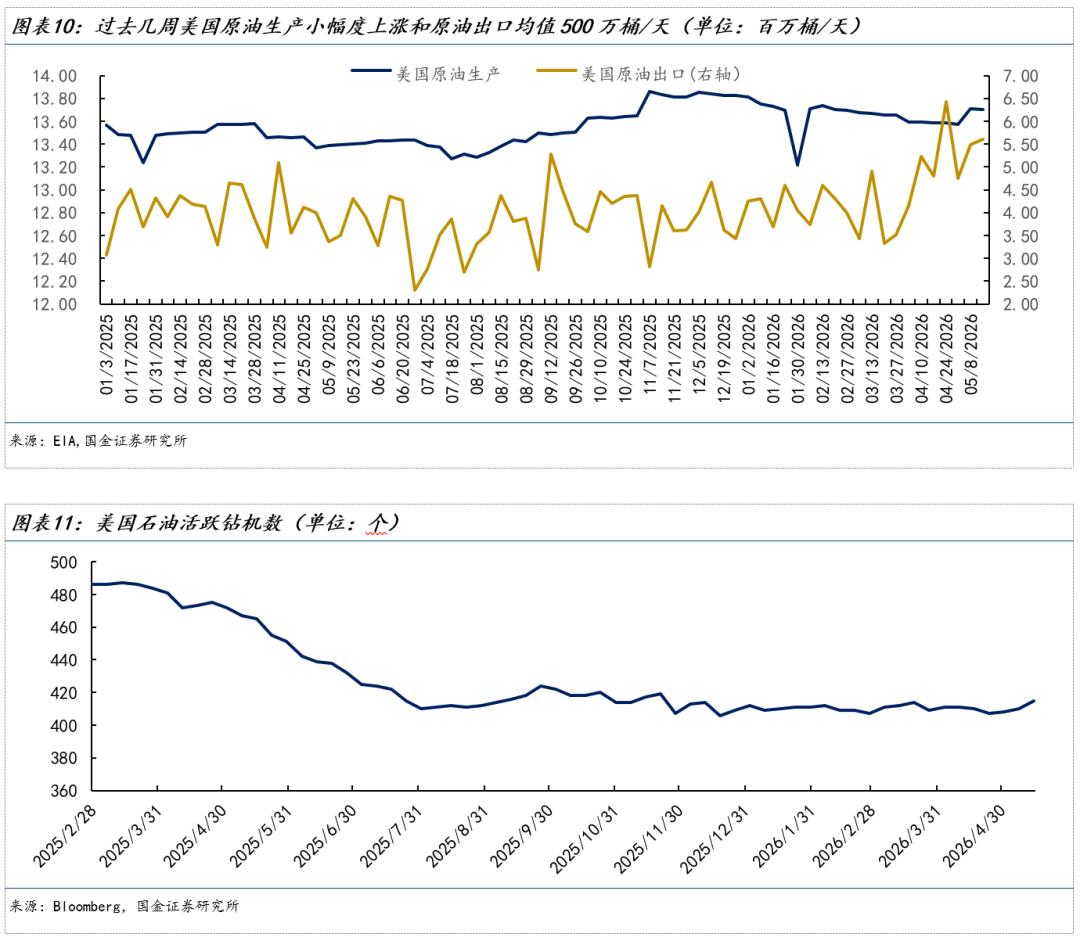
Second, the UAE’s exit may weaken oil’s policy floor, namely the market’s trust in OPEC+’s collective cutting capacity to support prices. Data shows the direct impact of the UAE exit on oil prices is still manageable. In 2025, the UAE will account for 4.5% of global crude oil output, 12.8% of OPEC’s, and 8.3% of OPEC+’s. Looking at effective spare capacity before the conflict, available capacity is extremely concentrated. For January–February 2026, Saudi Arabia and UAE are the main sources of effective spare; Saudi Arabia is dominant (about half), with the UAE about a third that size.
The UAE’s withdrawal may not collapse the alliance, but will weaken its discipline and prompt the market to reassess non-Saudi members’ willingness to cooperate. If more members no longer adhere strictly to quotas and focus on restoring output and securing market share, the alliance shifts from "collective support" to "Saudi unilateral support". This means in low price periods, Saudi Arabia must either keep cutting and sacrifice share, or abandon support and accept a weaker price floor.
Therefore, the UAE exit itself may not cause a sharp price drop right away, but if Saudi Arabia cannot continue to discipline the other members, trust in collective cuts will fall, eroding the price floor, leading to more volatility and a medium-term bearish tilt.
Third, while US shale oil can still fill gaps in the short term, it is unlikely to rapidly reshape the global supply curve as in the previous cycle.
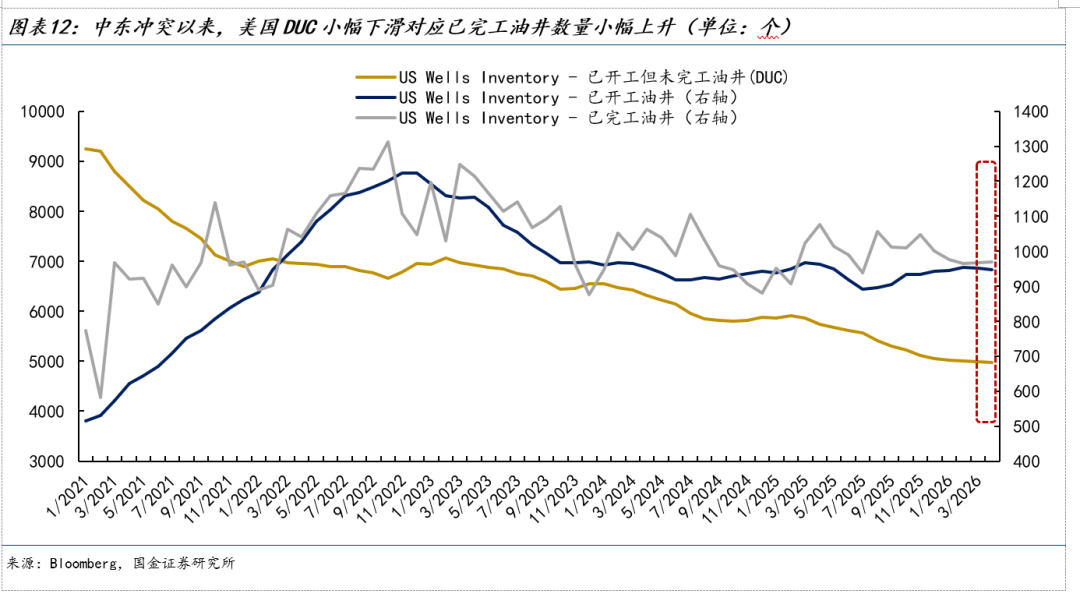
High prices and Middle Eastern disruptions have indeed propelled a recovery in US supply. As of the week ending May 15, US crude output climbed to 13.7 million barrels per day, with exports at 5.6 million; during the week of April 24 exports even hit 6.44 million—over a 60% increase since late February—making the US a vital gap-filler for Europe and Asia.
However, most of this came from a quick activation of a small number of DUC (drilled but uncompleted wells) and a revival in well completion activity, rather than a new large-scale drilling boom. As of May 15, the US had 415 active drilling rigs—slightly up from before, but still below the 465 of the previous year. Several shale executives noted that even if oil prices exceed $100 a barrel, unless the price holds for over a quarter, it won’t likely trigger significant drilling increases. Furthermore, it typically takes 6–12 months from adding rigs to seeing new supply enter the market.
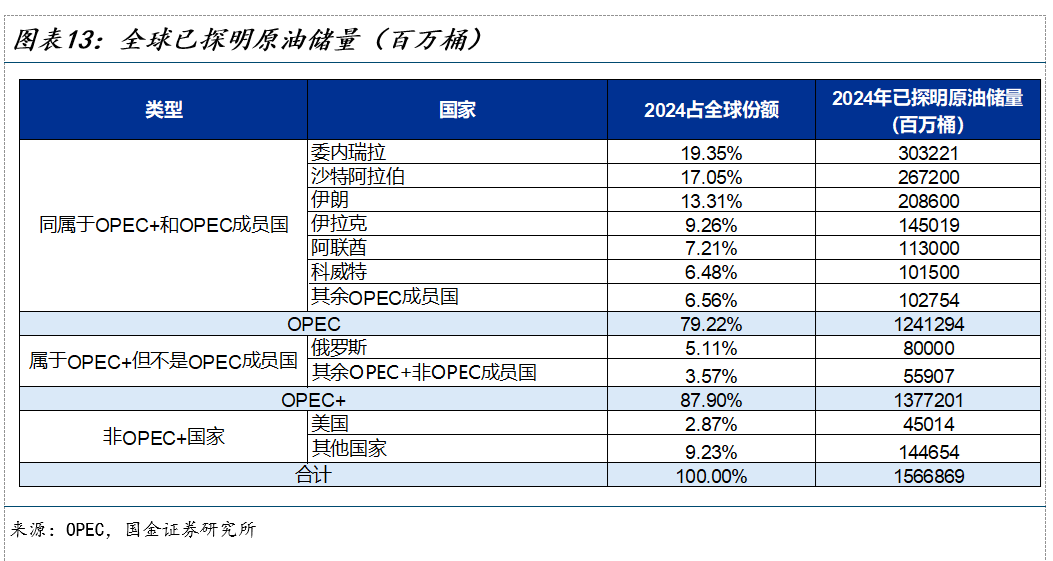
At the same time, the US is rebuilding a supply network centered around itself through oil company investment, sanction waivers, and friend-shoring resources, but this takes time. Take Venezuela: it has one of the world’s largest proven crude reserves. Since the US eased some restrictions, Chevron and others have resumed operations there, but aging infrastructure, insufficient refinery utilization, and constraints on diluents and power still limit its output recovery; large-scale expansion will require years.
Therefore, in the short term, the initiative in global crude supply still depends mostly on OPEC+, but over the medium term, as resources like Venezuela’s come online, the US may regain influence over oil prices.
3. Crude Oil Enters a New Pricing State
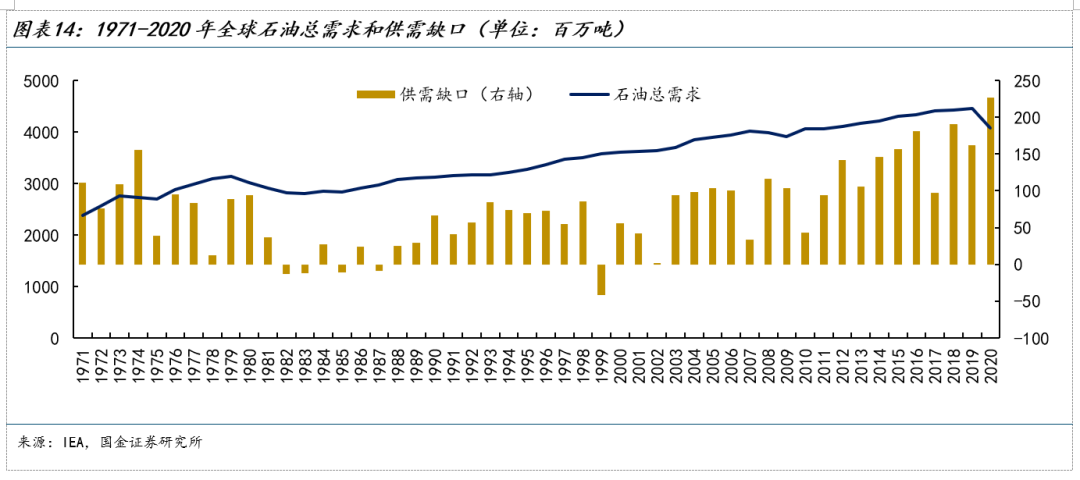
From 2000 to 2020, global oil demand was the key driver of the rising oil price center. China’s WTO accession led to accelerated industrialization and urbanization across Asia, shifting the global oil consumption center from Europe/US to Asia, moving the demand curve to the right and supporting the rising price center during that period.
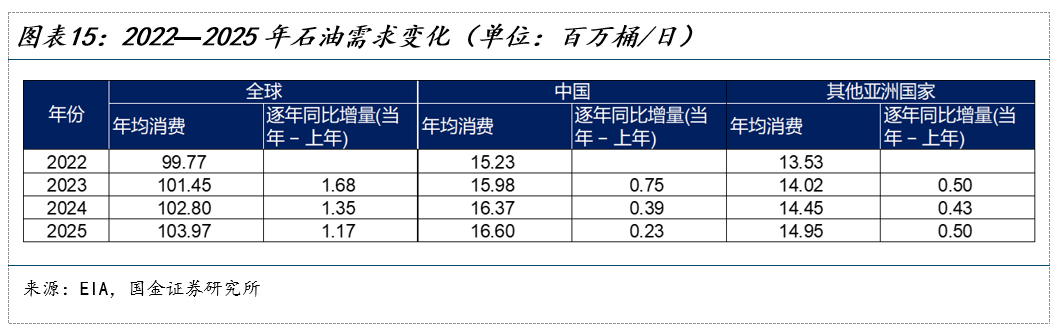
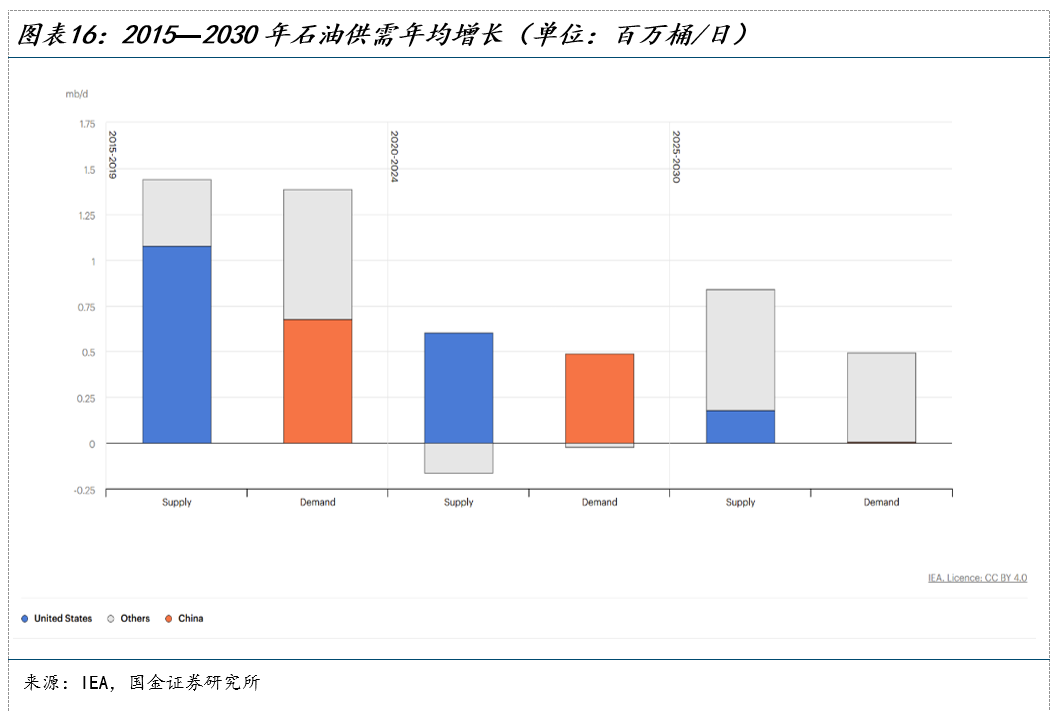
However, since 2020, the logic of oil demand and prices has changed. Global oil demand has recovered from the COVID shock, but the growth rate has slowed and is transitioning from high-speed to slow growth. Data shows global annual oil demand growth has declined from about 1.68 million barrels per day in 2023, to 1.35 million in 2024, and 1.17 million in 2025. China, which once drove the price center shift, is seeing incremental demand fall from about 0.75 million barrels/day in 2023 to about 0.23 million in 2025, with a clear reduction in marginal contribution.
New demand growth is shifting toward emerging markets such as India and Southeast Asia, but these economies’ size, degree of industrialization, and energy consumption elasticity make it difficult to reproduce the demand shock China delivered in the 2000s. At the same time, the cumulative effect of energy substitution is ongoing; the rising share of EVs, natural gas, and renewables is also compressing oil’s long-term growth potential. As such, demand no longer supports a sustained, one-way rise in the price center.
But low end-user demand growth does not mean prices will fall back smoothly after the crisis. The commercial stockpiles depleted during the Hormuz crisis need replenishment; national strategic reserves may also be restocked, creating an additional post-crisis demand phase. Crucially, this type of demand is essentially a one-off correction, not a sustained flow increase. Thus, post-crisis demand strength is “borrowed” and does not alter the judgment of long-term slow demand growth.
Take the US as an example: during the Russia-Ukraine conflict, it drew down its strategic petroleum reserve (SPR) to around 350 million barrels by mid-2023, the lowest since 1983. However, restocking has since been extremely slow, mainly due to three constraints: 1) Fiscal constraint—the 2022 emergency sale’s proceeds were not all used for oil buybacks, with some allocated to the federal budget; 2) Price constraint—the Department of Energy prefers restocking at $67–$72 per barrel, with repurchases slowing above this range; 3) Facility constraint—aging storage sites and maintenance needs limit rapid, large-scale restocking capacity.
Unlike the 2022 Russia-Ukraine war, post-Hormuz crisis, countries may be more willing to rebuild stocks, especially energy importers with weaker reserves, which may prefer higher safety stock levels. But willingness does not equate to capability; the pace will still depend on oil price levels, fiscal bandwidth, balance of payments constraints, storage capacity, fill rates, and other physical conditions. Thus, restocking strategic reserves is more likely to provide a long-tailed price floor rather than a sharp short-term demand shock.
Thus, this is not a new demand-driven bull market. Supply shocks can push prices temporarily higher, and restocking can slow price declines, but without sustained end-use demand, the price center is unlikely to remain elevated for long. In form, this round is unlike the pricing power shifts of 1973 or the demand supercycle of the 2000s, but more characterized by stage-centric increases driven by risk premiums: prices spike faster, retreat more slowly, rarely return fully to pre-shock levels, and experience higher volatility centers.
Prices spike quickly because futures and options markets rapidly price in supply interruptions. They retreat more slowly because while prices quickly reflect risks, restoring the physical supply chain takes time. Full return is difficult because once Hormuz risk shifts from a short-term passage issue to a trust issue, the market may retain a risk premium for a long time. Higher volatility arises from repeated adjustments due to the different reaction speeds of futures and physical markets.
In this new framework, both the upper and lower bounds of oil prices are being re-evaluated. On the upper side, slow demand growth limits how long high prices persist. If high oil prices last, they can self-correct via demand slowdowns and restocking cool-downs; thus, the upper bound depends more on demand absorption, not just supply shocks.
On the lower bound, in the short term, it is still set by “OPEC+ policy support + shale breakeven cost.” OPEC+ production cuts remain important support, but the UAE exit and declining cooperation from members erode trust in its collective capacity, making the price floor more reliant on Saudi Arabia’s unilateral decisions. If Saudi Arabia continues to cut and support prices, the lower floor remains; if not, or if it cannot constrain others, tail risk of breaching the old floor grows.
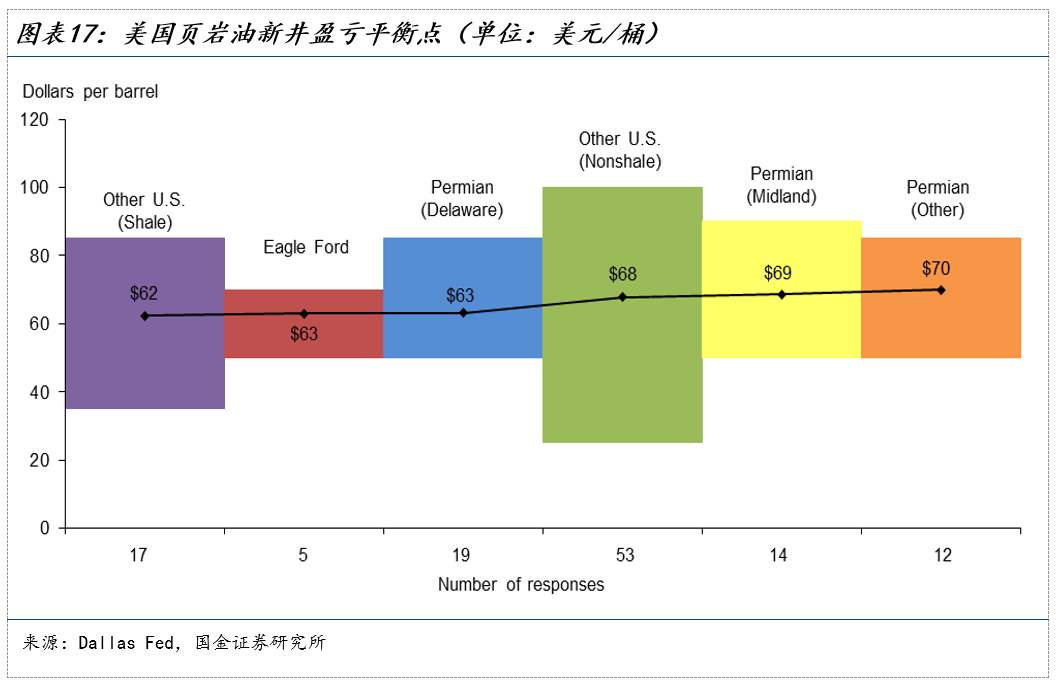
Meanwhile, the shale cost line remains secondary support in low-price phases. If oil falls to the breakeven zone for new US shale wells, expansion slows, new supply shrinks, and costs again support prices. Dallas Fed’s Q1 2026 survey shows breakeven for new US shale wells is roughly $60–$70 per barrel. When WTI falls toward this range, US output expansion slows, again supporting prices.
In the long term, if the US ramps up domestic shale and reorganizes overseas resources for a larger non-OPEC+ supply share, marginal cost within the US system may become the new cost anchor. But this is not an absolute floor. If OPEC+ pivots from price support to share grabs, released supply could overwhelm cost support, driving prices even lower.
Therefore, the Hormuz crisis is not the start of a new long-term bull market in oil, but a re-pricing of risk following the loosening of the old pricing regime. While it makes it harder for prices to return to the pre-conflict baseline and will lift the central price level for a period, ultimately, demand limits the endurance of high oil prices. The final outcome is not a one-way rise, but a widening price range, increased volatility center, and greater tail risk.
Disclaimer: The content of this article solely reflects the author's opinion and does not represent the platform in any capacity. This article is not intended to serve as a reference for making investment decisions.
You may also like
Australia Q1 GDP misses expectations: What 0.3% growth means for AUD/USD
PBOC sets USD/CNY reference rate at 6.8184 vs. 6.8187 previous