GBP/USD Price Forecast: Reflects sideways trend amid US-Iran deadlock

The GBP/USD pair ticks up to near 1.3430 during the early European trade on Thursday, but has been broadly sideways in a range between 1.3407 and 1.3485 over the last four trading days. The Cable struggles for direction as negotiations between the United States (US) and Iran regarding the permanent peace deal fail to make a breakthrough.
Earlier this week, Iran's Tasnim News agency reported on Monday that members of the negotiating team of Tehran have stopped message exchanges with the US through mediators in protest against attacks on Lebanon.
However, US President Donald Trump confirmed on Wednesday that negotiations have not halted and even Iran's Ayatollah [referring to Supreme Leader Mojtaba Khamenei] is involved in negotiations with Washington.
The ongoing closure of the Strait of Hormuz is broadly hurting currencies from economies that rely heavily on oil imports to meet their energy needs.
Meanwhile, investors await the US Nonfarm Payrolls (NFP) data for May, which will be released on Friday. Investors will pay close attention to the US official employment data to get fresh cues regarding the Federal Reserve’s (Fed) monetary policy outlook.
GBP/USD technical analysis
GBP/USD edges higher at around 1.3430 at press time; however, the pair holds a near-term bearish bias as it stays below the 20-period Exponential Moving Average (EMA), which is at 1.3456. The Symmetrical Triangle formation reflects that the overall trend is sideways.
The Relative Strength Index (RSI) oscillates inside the 40.00-60.00 zone, reflecting indecisiveness among investors.
On the topside, initial resistance is seen at the 20-period EMA near 1.3456, with the downward-sloping border of the above-mentioned chart pattern around 1.3478 acting as the next barrier and a level that would need to be reclaimed to ease the current bearish tone. On the downside, the first notable support sits at the Triangle's upward-sloping border near 1.3408; a sustained move below this zone would open the way for further weakness toward the May 18 low at 1.3300.
(The technical analysis of this story was written with the help of an AI tool.)
Disclaimer: The content of this article solely reflects the author's opinion and does not represent the platform in any capacity. This article is not intended to serve as a reference for making investment decisions.
You may also like
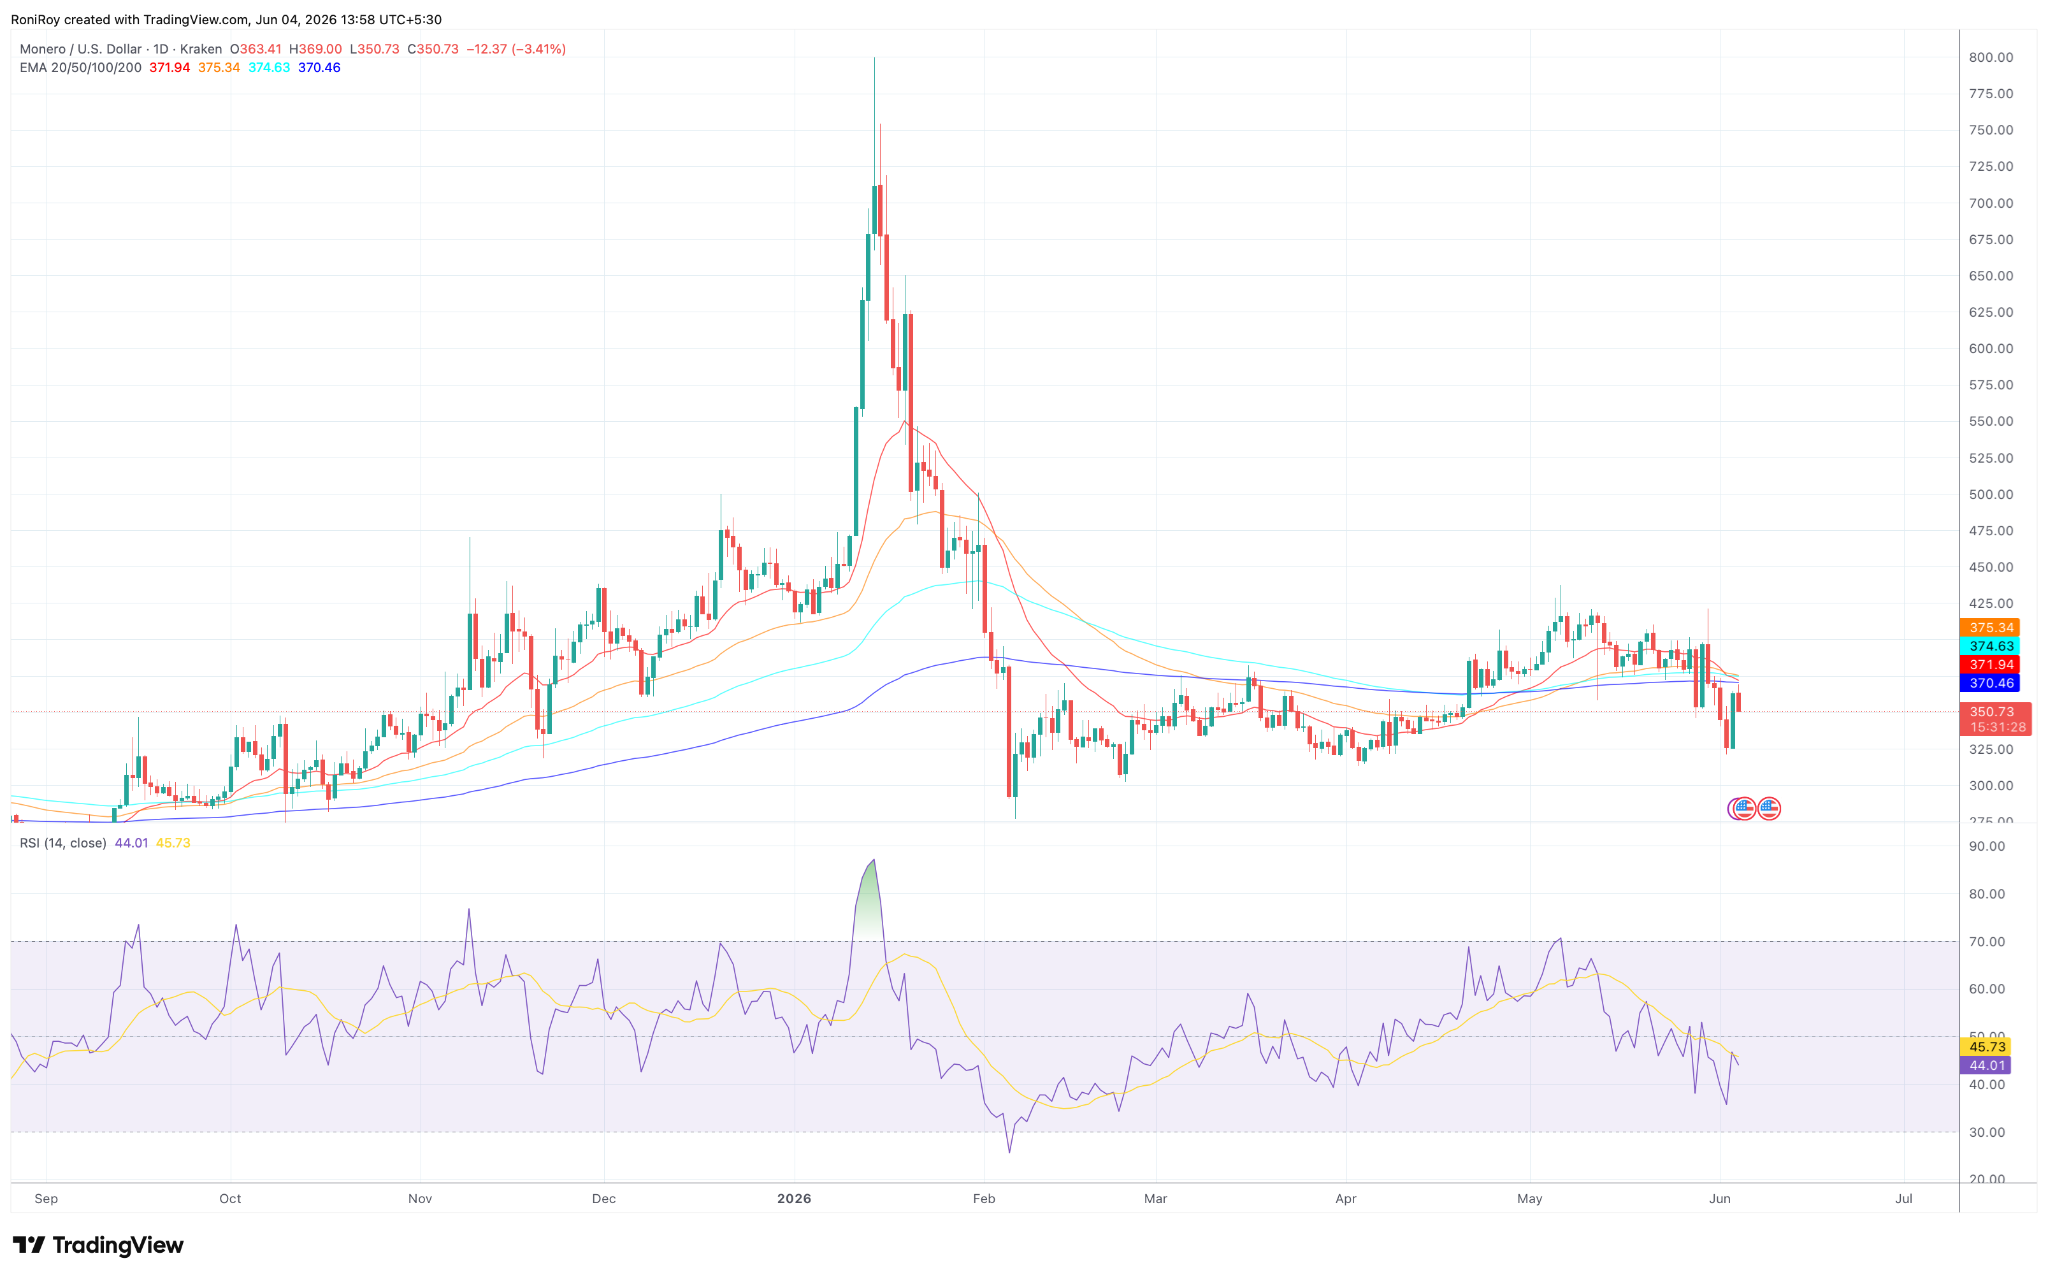
Monero rebounds from $330 lows as bulls eye major breakout
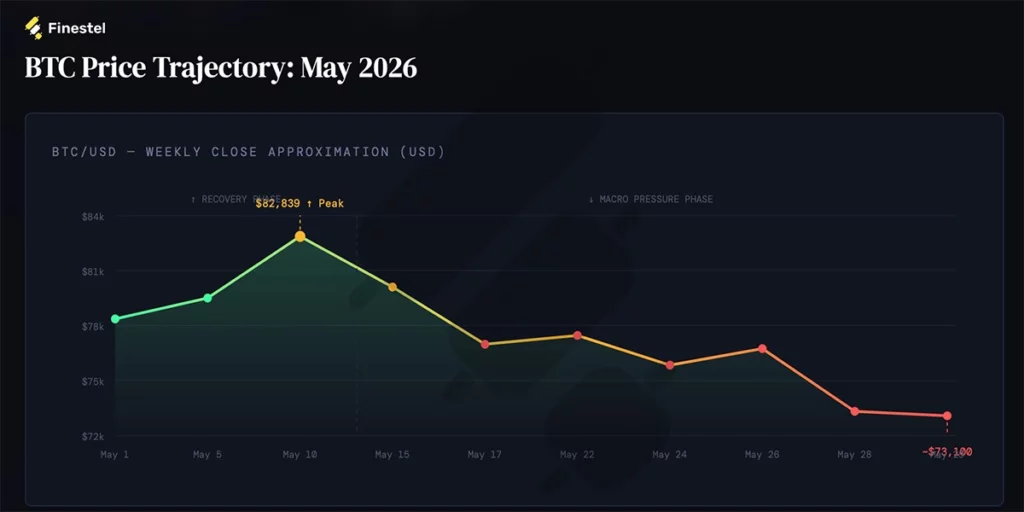
Bitcoin slipped below key cost basis levels during May market correction: Finestel
Bitcoin quantum discount hits 28% as BTC price sinks near $62K
Bitcoin and Ethereum Prices Dip to Greater Lows, Bullish Analysts Remain Undeterred