

XRP experienced a drop in its latest sessions, echoing the general weakness across the cryptocurrency market. Pressured by continued selling in both Bitcoin and Ethereum, the token dipped below the $1.20 threshold, touching as low as $1.1401 during the session. Although there were signs of a subsequent recovery, short-term technical signals suggest that bearish pressure remains unresolved for now.
XRP falls below $1.20 as downside risk grows
By:Cointurk
Bitget offers one-stop trading for cryptocurrencies, stocks, and gold. Trade now!
A welcome pack worth 6200 USDT for new users! Sign up now!
Price stuck between $1.15 and $1.20
Current price action shows XRP trading within a narrow band between $1.15 and $1.20. At the time this article was published, XRP was trading at approximately $1.22, representing a modest increase of around 1% in the past 24 hours. Nevertheless, the price remains below its 100-hour simple moving average, a sign that downward momentum has not been exhausted in the short term.
The hourly chart reveals a downward-sloping trendline, with initial resistance situated at the $1.1950 level. In addition, XRP has failed to reclaim the 23.6% Fibonacci retracement level, calculated from the drop between $1.3640 and $1.1401, limiting the prospects for a swift rebound.
Mini glossary: The Fibonacci retracement is a tool used in technical analysis to identify levels where prices may temporarily pause after significant rises or falls. Investors often track these levels as potential zones of support or resistance.
$1.32 seen as critical resistance
From a technical standpoint, any sustainable recovery in XRP requires a decisive close above $1.1950. Should this occur, resistance levels at $1.20, $1.22, and $1.25 could come into play. However, a more definitive trend reversal would likely need to see XRP breach the $1.32 mark, which stands out as a major resistance zone.
According to analysis, a convincing close above $1.32 could pave the way for a move up to $1.43, which would mark an approximate 17% gain from current prices. Still, the presence of a negative histogram structure in the MACD indicator suggests that bearish momentum has not completely dissipated.
Technical analyst ChartNerd wrote on X (formerly Twitter) that XRP has slipped below the upper regression band of the Gaussian Channel at $1.35. Based on previous instances, he notes that such a break has historically pulled the price down to the middle regression band, which currently stands at $0.84.
Known for his technical analysis posts on social media, ChartNerd remains a prominent market observer. He indicated that if support levels continue to erode, a deeper correction toward $0.84 could remain on the table at some point in 2026.
Latest on support zones
If the downtrend extends, the initial support lies at $1.16, followed by a secondary support at $1.155. Breaching this area would turn attention to $1.15 and $1.144, while a drop below $1.144 would leave $1.14 as the final, albeit weaker, support zone in the near term.
The Relative Strength Index (RSI) currently indicates oversold conditions for XRP. This could trigger some short-term buying as traders react to the signal. Nevertheless, analysts emphasize that an oversold RSI alone does not guarantee the start of a lasting upward trend; confirmation from other technical indicators is still needed.
0
0
Disclaimer: The content of this article solely reflects the author's opinion and does not represent the platform in any capacity. This article is not intended to serve as a reference for making investment decisions.
Understand the market, then trade.
Bitget offers one-stop trading for cryptocurrencies, stocks, and gold.
Trade now!
You may also like
ECB: Inflation expectations and household demand – BNY
FXStreet•2026/06/04 10:12
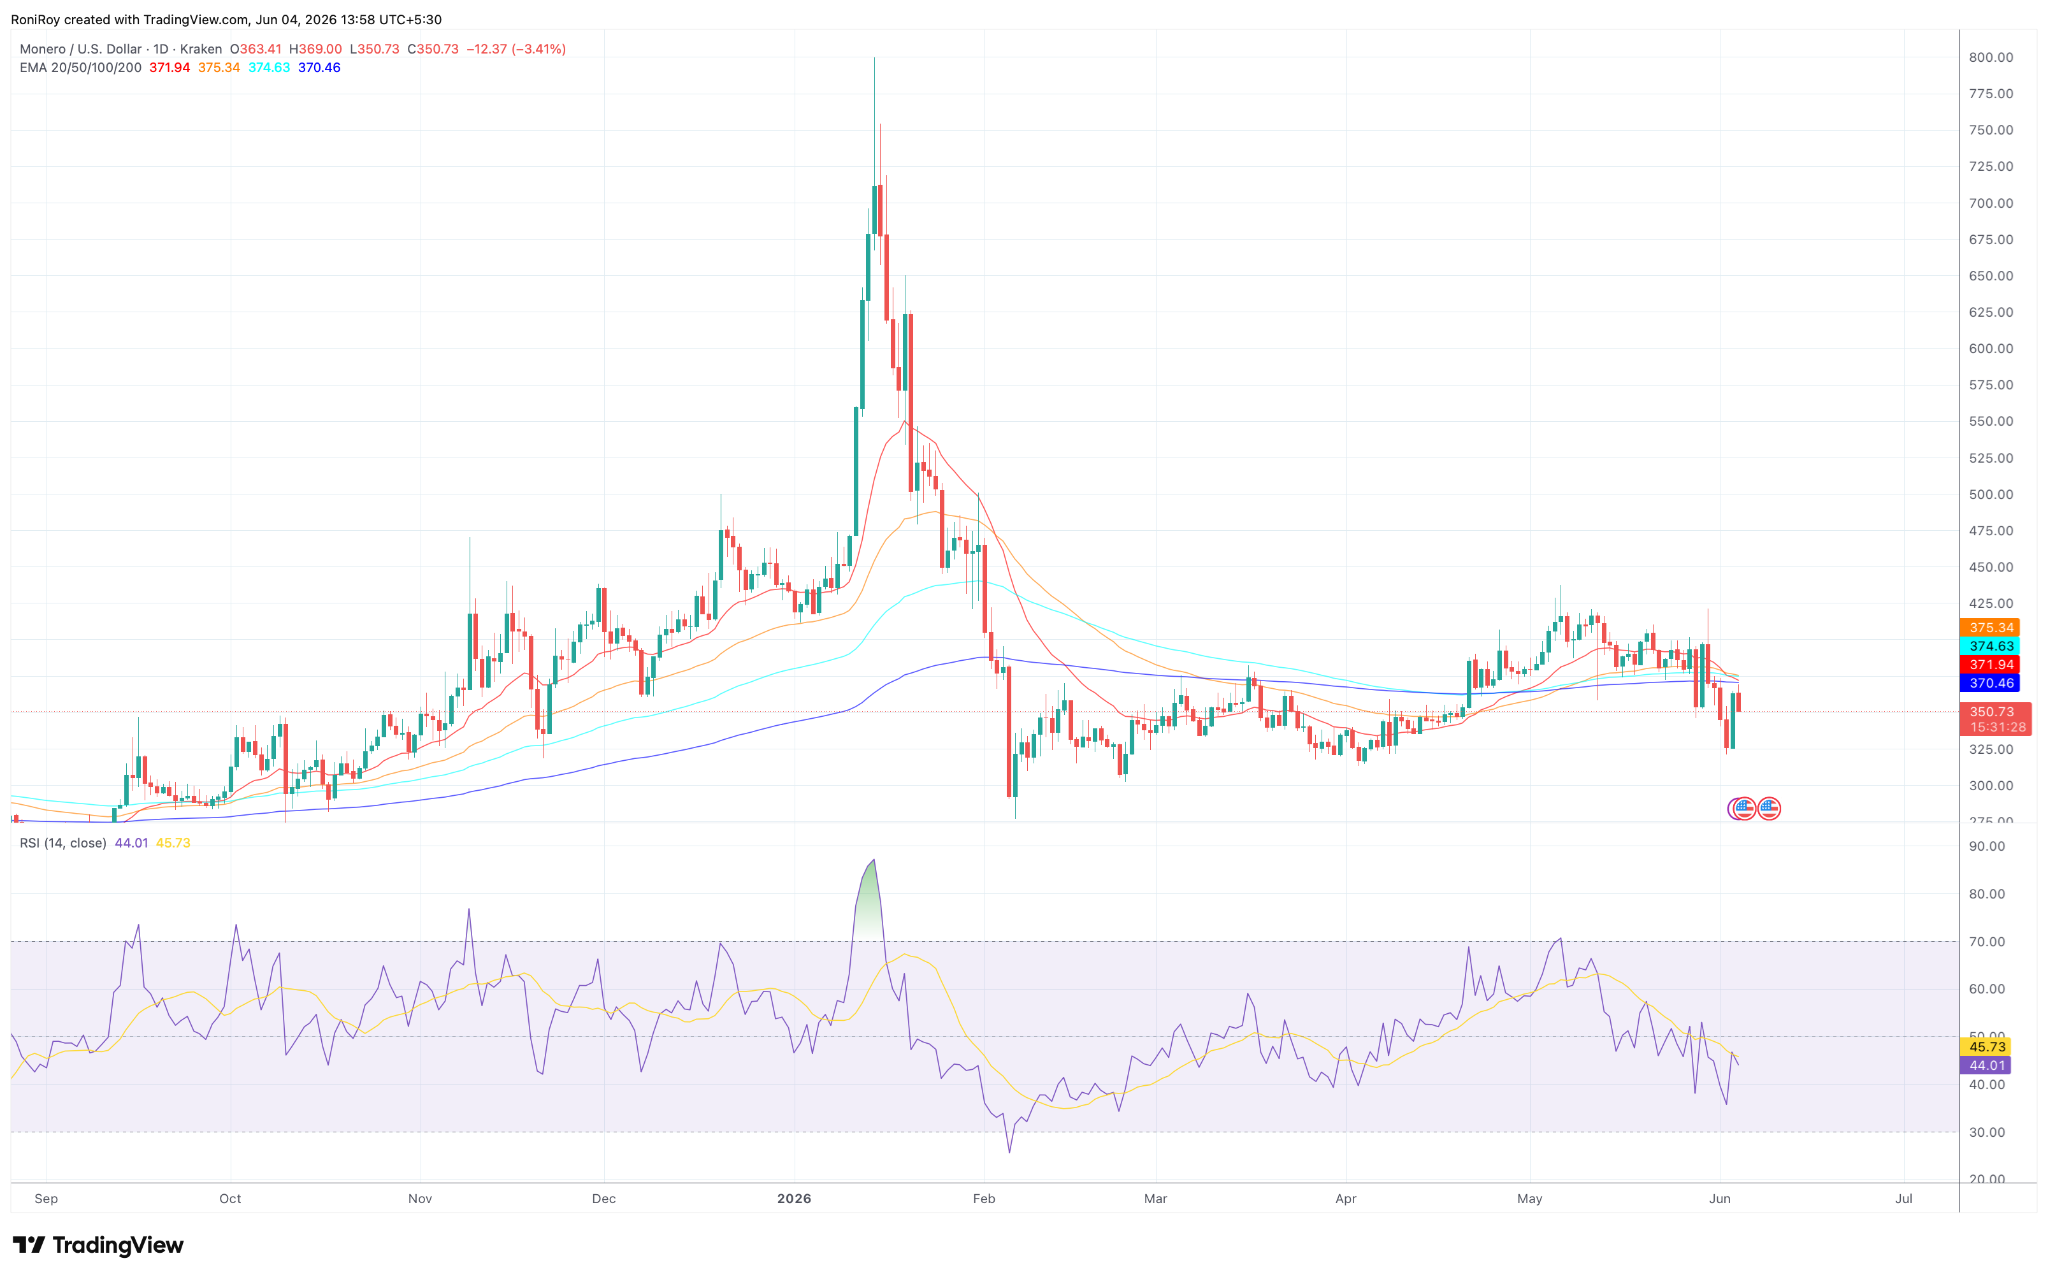
Monero rebounds from $330 lows as bulls eye major breakout
CryptoNewsNet•2026/06/04 10:09
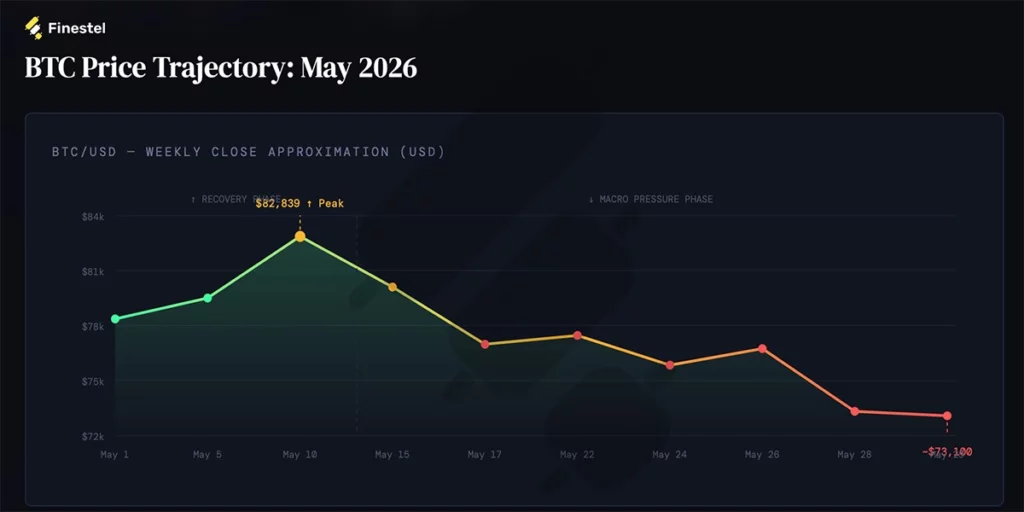
Bitcoin slipped below key cost basis levels during May market correction: Finestel
Crypto.News•2026/06/04 10:03
Bitcoin quantum discount hits 28% as BTC price sinks near $62K
Crypto.News•2026/06/04 10:00
Trending news
MoreCrypto prices
MoreBitcoin
BTC
$63,157.5
-5.71%
Ethereum
ETH
$1,763.54
-5.90%
Tether USDt
USDT
$0.9985
-0.01%
BNB
BNB
$595.98
-7.10%
USDC
USDC
$0.9997
+0.01%
XRP
XRP
$1.16
-6.61%
Solana
SOL
$68.51
-8.73%
TRON
TRX
$0.3275
-1.41%
Hyperliquid
HYPE
$66.87
-7.21%
Dogecoin
DOGE
$0.08761
-6.63%
How to buy BTC
Bitget lists BTC – Buy or sell BTC quickly on Bitget!
Trade now
Become a trader now?A welcome pack worth 6200 USDT for new users!
Sign up now