
Why is the Ripple (XRP) Price Down This Week? (June 4)

XRP is down 9% on the weekly chart! Can the support at $1 stop the downtrend?
Ripple (XRP) Price Predictions: Analysis
Key support levels: $1
Key resistance levels: $1.4, $1.6, $2
Downtrend Resumes
After three months of XRP moving sideways to form a large pennant, the price finally fell below it. With this latest drop, XRP resumes its downtrend, which is on a collision course with the $1 support level.
Unfortunately, buyers have vanished from the order books as crypto assets across the board are in the red this week. XRP is no different and was unable to stop the recent sell pressure. Because of this, lower lows are likely in the future.
Key Support Approaching
The most important support level right now is found at $1. This level has not been tested so far this year, and it’s likely to be tested in the near future if this downtrend continues at this pace.
For buyers to return, XRP needs to become attractive again. A price around $1 is also a key psychological level that has a good chance of triggering a battle between buyers and sellers. Hopefully, this level will allow for a relief rally once tested.
Bearish Cross on 3-Day MACD
Last week, we discussed the bearish cross on the 2-day timeframe. However, since then, the 3-day MACD also did a bearish cross. This reconfirms the downtrend and encourages sellers to take positions expecting new lows.
Sellers have been dominating since mid-May when buyers had a last attempt at a breakout. That move turned into a bullish trap, and the price has been going down non-stop since.
Disclaimer: The content of this article solely reflects the author's opinion and does not represent the platform in any capacity. This article is not intended to serve as a reference for making investment decisions.
You may also like
ECB: Inflation expectations and household demand – BNY
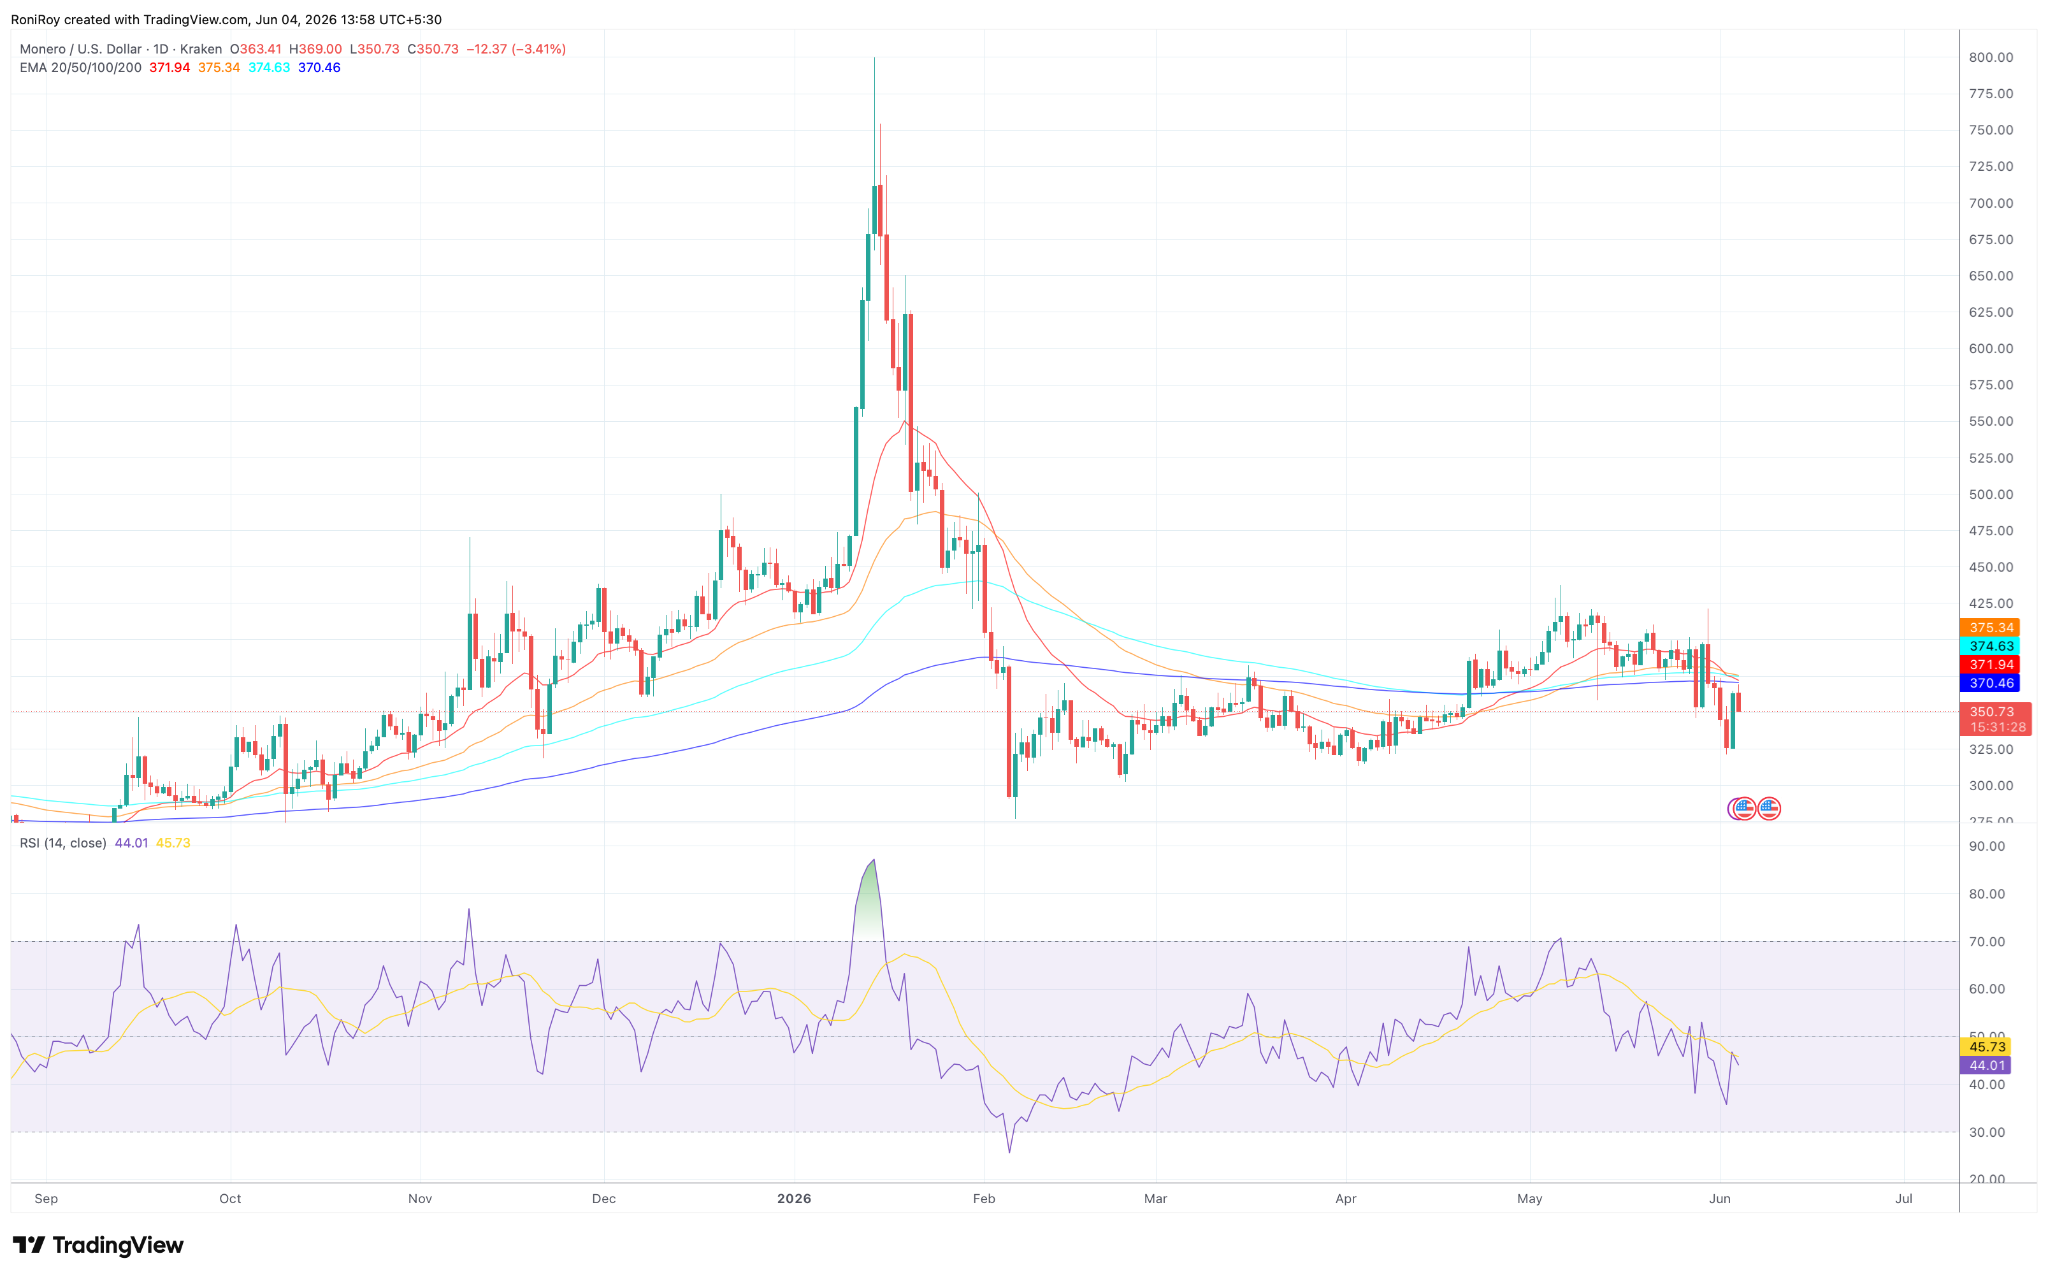
Monero rebounds from $330 lows as bulls eye major breakout
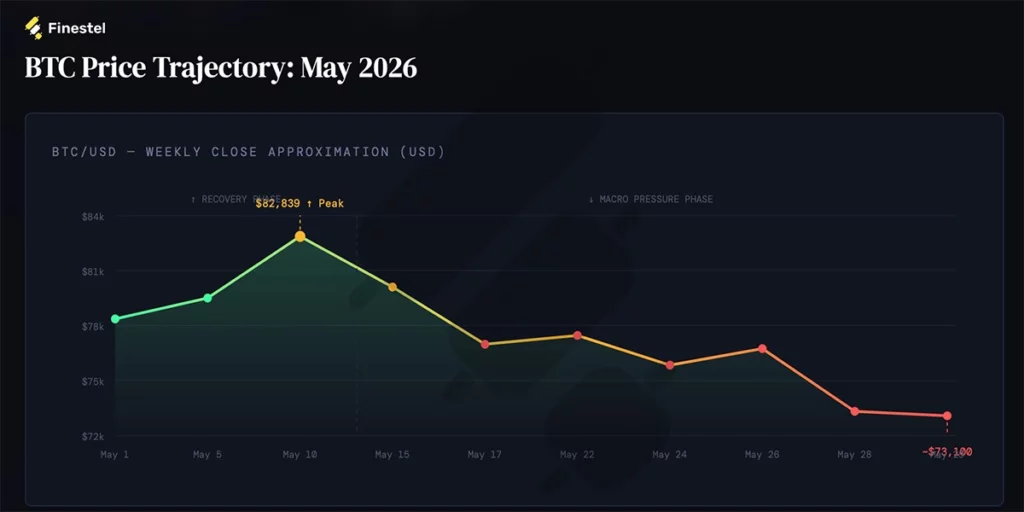
Bitcoin slipped below key cost basis levels during May market correction: Finestel
Bitcoin quantum discount hits 28% as BTC price sinks near $62K