Silver Price Forecast: XAG/USD recovery stalls below the 50-day SMA

Silver (XAG/USD) climbs more than 2% on Thursday as a ceasefire agreement between Israel and Lebanon weighs on the US Dollar (USD). At the time of writing, XAG/USD is trading around $74.80, but remains stuck within a familiar range between $72-$78 that has held since mid-May.
What's keeping Silver stuck in a range?
The metal is struggling to break out as the market awaits a clearer signal from the US-Iran talks. While the Israel-Lebanon ceasefire has improved sentiment and removed one obstacle in the diplomatic process, key issues between Washington and Tehran remain unresolved.
At the same time, the recent rise in Crude Oil prices has added to inflation concerns. That has fueled expectations that major central banks, including the Federal Reserve (Fed), may need to keep interest rates higher for longer. Higher borrowing costs tend to weigh on precious metals because they reduce the appeal of non-yielding assets.
What could trigger a breakout?
A meaningful breakthrough in the US-Iran negotiations could be the catalyst Silver has been waiting for. A deal between the two sides could lead to the reopening of the Strait of Hormuz, easing concerns over supply disruptions and potentially pushing Crude Oil prices lower. That would help reduce inflation pressures and could prompt markets to scale back expectations for higher interest rates.
On the other hand, renewed tensions or a breakdown in negotiations could boost demand for the US Dollar while driving Oil prices higher, increasing the risk of a downside break in XAG/USD.
Technical Analysis:
On the daily chart, XAG/USD keeps a bearish near-term bias as spot holds beneath the 50-day Simple Moving Average (SMA) at roughly $76.20 and well below the 100-day SMA near $80.84, while still trading comfortably above the 200-day SMA around $67.65.
The Relative Strength Index (RSI) is around 46, while the Moving Average Convergence Divergence (MACD) remains negative, which together hint that momentum still favors the downside, even as price consolidates above its longer-term trend floor.
On the topside, immediate resistance is seen at the 50-day SMA around $76.20, with a stronger barrier aligned at the 100-day SMA near $80.84, and only a break above this zone would ease the current corrective tone.
On the downside, immediate support is seen at the horizontal level near $72.00, ahead of the 200-day SMA clustered around $67.65, a break of which would open the door to a deeper retracement.
(The technical analysis of this story was written with the help of an AI tool.)
Disclaimer: The content of this article solely reflects the author's opinion and does not represent the platform in any capacity. This article is not intended to serve as a reference for making investment decisions.
You may also like
JPMorgan says crypto bill may have only a narrow window for passage this year
Hyperliuid dips below $70, but institutional demand remains high

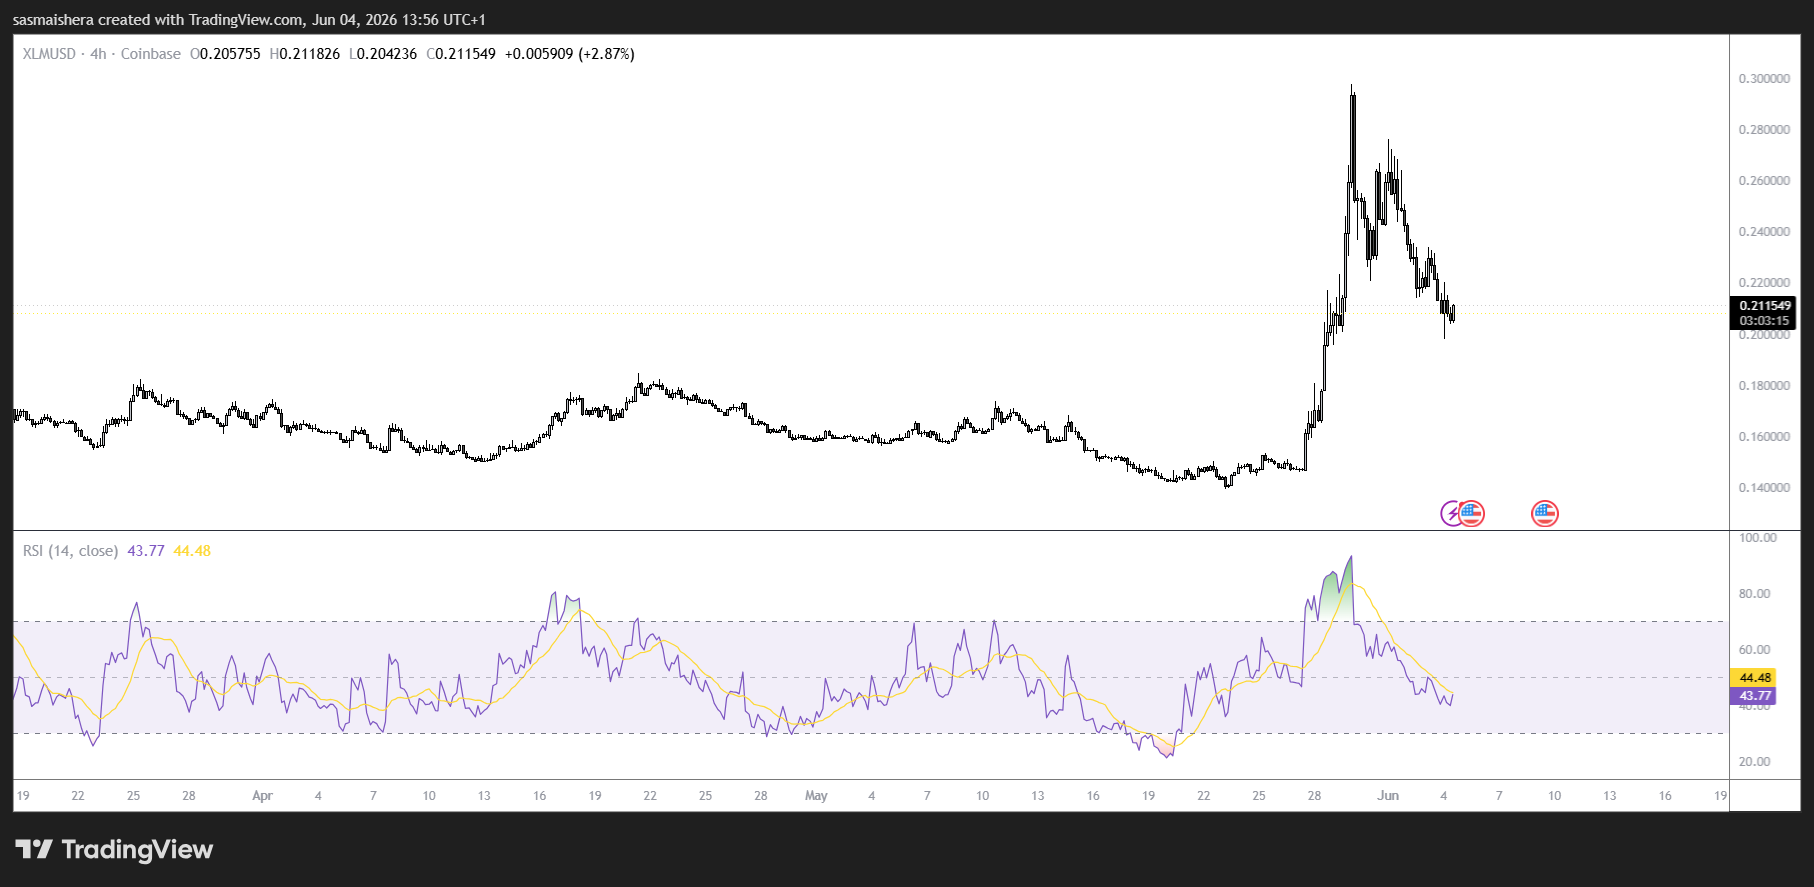
XLM extends losses as weak retail demand weighs on sentiment
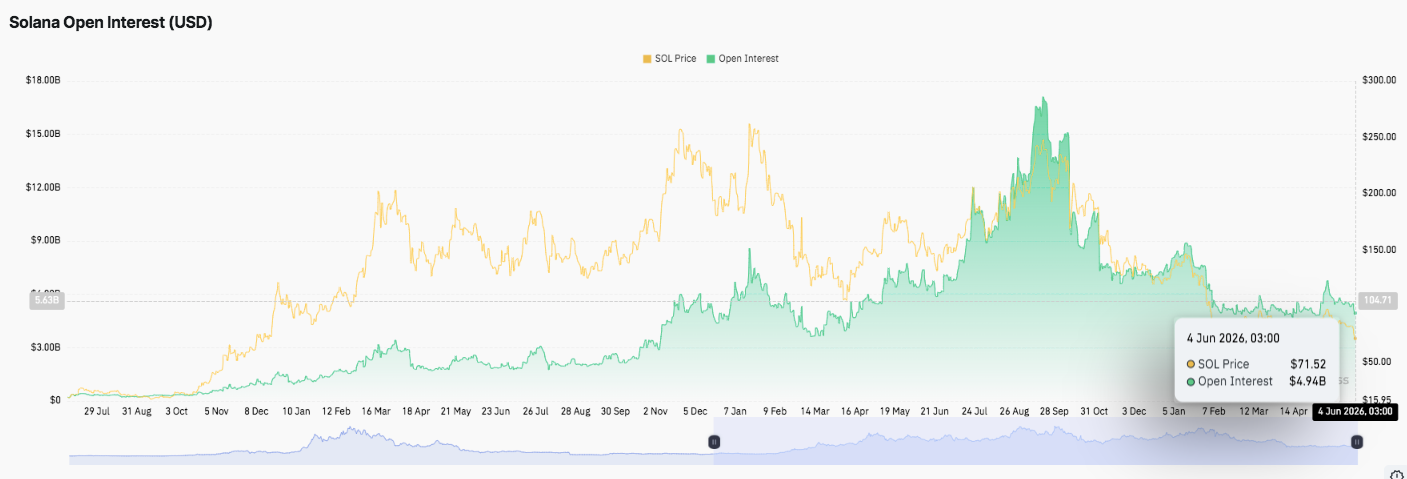
Solana Price Prediction: Bears Tighten Grip as SOL Tests Critical Support Near $67