-
SIREN is testing a critical resistance zone near $1.30-$1.35 after a sharp recovery from May lows, following a huge spike in the open interest
-
A breakout above resistance could open the door toward $2.12 and $3.14, while rejection may send the price back toward $0.82 support.
SIREN has emerged as one of the strongest-performing AI-related tokens this week, climbing toward a critical resistance zone as traders aggressively increase leveraged bets. The price has surged over 48%, reaching $1.25 with a massive increase in the trading volume of over 450%. The latest rally comes alongside a sharp surge in Open Interest, suggesting fresh capital is entering the market rather than merely rotating existing positions.
However, with SIREN price approaching a key trendline resistance and RSI entering overheated territory, traders are now asking whether this is the start of a larger breakout or another rejection similar to previous attempts.
SIREN Price Tests Major Resistance
SIREN price is approaching a crucial technical level after staging a powerful recovery from its May lows. It is now testing the intersection of horizontal resistance and long-term trendline resistance near $1.30–$1.35. A successful breakout above this region could signal a shift in market structure and potentially open the door for a move toward the next major resistance level around $2.12.
Momentum indicators continue to support the bullish case. The Relative Strength Index (RSI) has climbed above 70, reflecting strong buying pressure, while the MACD remains in positive territory with expanding bullish momentum. These indicators suggest buyers currently maintain control of the trend.
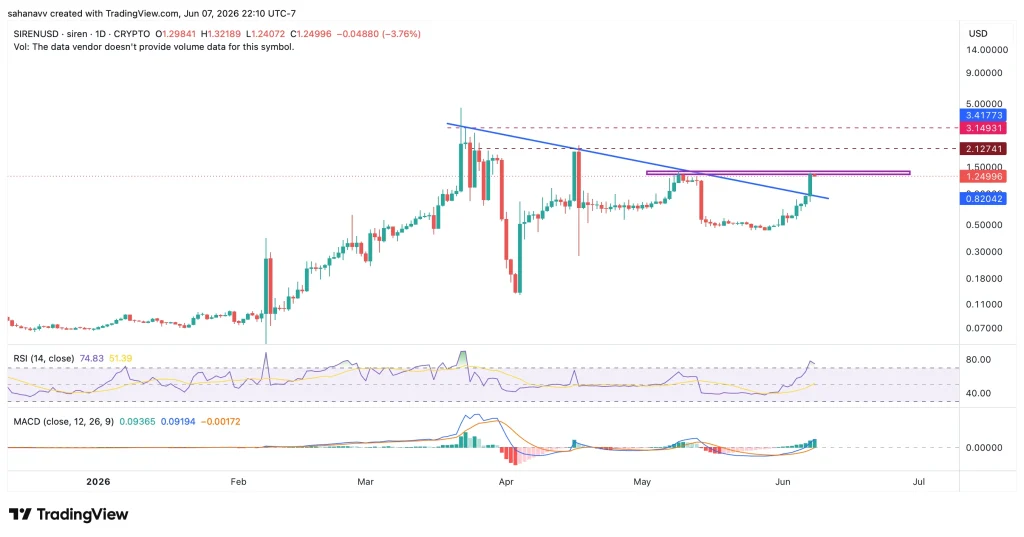
However, resistance remains a significant hurdle. A decisive daily close above $1.35 would provide the strongest confirmation that the breakout is genuine. Until then, traders may continue to view the current rally as a breakout attempt rather than a confirmed trend reversal. As SIREN price trades near one of its most important resistance levels of 2026, the next few trading sessions could determine whether the token extends its recovery toward higher targets or faces another rejection from a historically significant supply zone.
Open Interest Jumps Toward $100 Million, Signaling Rising Trader Conviction
According to Coinglass data, SIREN’s Open Interest has surged from approximately $25 million in late May to nearly $100 million in early June. The sharp increase indicates that traders are actively opening new positions as the token approaches a major technical resistance level.
This suggests market participants are positioning for a potentially larger move as SIREN attempts to break above its multi-month downtrend resistance.
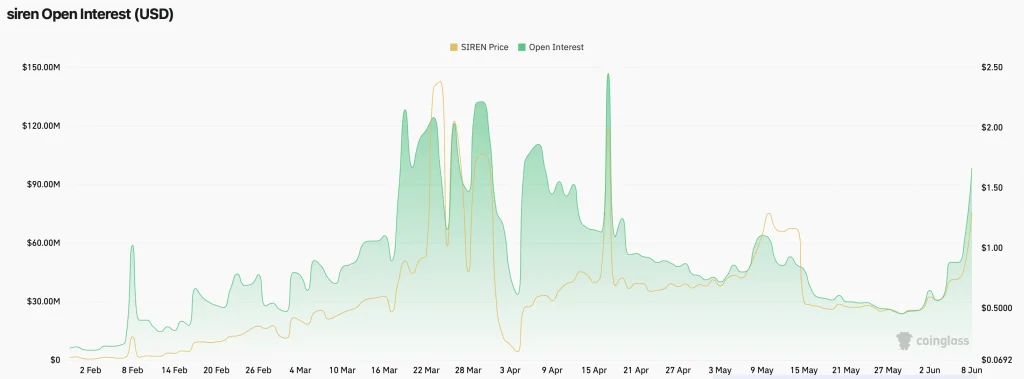
The recent spike in Open Interest is particularly significant because it coincides with SIREN’s recovery from the $0.50 region and its advance toward the critical $1.30-$1.35 resistance zone. The alignment between price appreciation and increasing derivatives activity points to growing speculative interest in the token.
With Open Interest reaching its highest level in weeks, SIREN appears to be entering a decisive phase where both spot and derivatives traders are preparing for the token’s next major move.
Key Bullish and Bearish Targets to Watch
As SIREN trades near a major resistance zone, the next directional move could have a significant impact on the token’s short-term outlook. Both the technical structure and derivatives activity suggest the market is approaching a decisive moment.
The bullish thesis remains intact as long as buyers continue defending higher lows and maintain pressure against the $1.30-$1.35 resistance zone. If bulls secure a breakout, the first major upside target sits near $2.12, rising over 60% from the current range. If selling pressure emerges near current levels, the first downside target is located around $0.82. Failure to hold $0.82 would increase the probability of a deeper correction toward the $0.50 region
Wrapping it Up
The latest market structure suggests that SIREN is entering a phase where conviction is being tested. Buyers have successfully reclaimed momentum following weeks of weakness, but the real challenge lies in transforming renewed optimism into a sustained trend shift.
The battle between bulls and bears is currently centered around the $1.30-$1.35 resistance zone. A confirmed breakout above this level could shift market structure in favor of buyers and expose higher targets at $2.12 and $3.14.
For now, SIREN price remains one of the more closely watched AI-related cryptocurrencies, with both bulls and bears eyeing the same key level. Whether the token delivers a confirmed breakout or another rejection will likely determine its trend direction for the remainder of June.