Bitget App
Trade smarter
Buy cryptoMarketsTradeFuturesStocksEarnInstitutionAI & More
AI Stocks Account for Nearly All of the S&P 500’s Recent Gains

AI Stocks Account for Nearly All of the S&P 500’s Recent Gains

CoinEditionCoinEdition2026/06/09 08:36
By:CoinEdition

The US stock market’s total value has surged to $75.7 trillion, pushing the market cap to GDP ratio to a record 238%. The entire US economy generates approximately $31.8 trillion in annual output. The stock market is now worth two and a half times that.

Context on how extreme this is:

  • The ratio sits 90% points above the dot-com bubble peak of 148% 
  • Since 2008, the US stock market has grown at five times the rate of the underlying economy
  • The ratio has surged 38% points since the S&P 500 bottomed on March 30

The top 10 stocks now represent 41% of the entire S&P 500, a level never recorded in 145 years of market history. The previous record was 27% at the dot-com peak.

Beneath the headline gains, market performance has become heavily concentrated in AI stocks rather than broad-based across the index. 

Since February 27, the S&P 500 has gained 7.34%, but excluding AI stocks leaves the index essentially flat (0%) over the same period. 

The concentration is also evident during selloffs. When the S&P 500 fell 2.64% on Friday, the other 493 non-AI companies moved just 0.02%, indicating that the decline was largely driven by a simultaneous selloff in AI stocks.

Anyone buying an S&P 500 index fund today is not buying diversified exposure to 500 American companies. They are placing a concentrated bet on AI, whether they realize it or not.

Investor positioning in large-cap tech has reached 1.0 points, higher than 97% of all readings over the past 16 years. This marks a sharp reversal from minus 0.4 points when the market bottomed in late March.

Analysts at Macro Alpha framed the risk, noting that when 97% of the market is positioned on the same side of the trade, the question becomes: who is left to buy? The answer is nobody. 
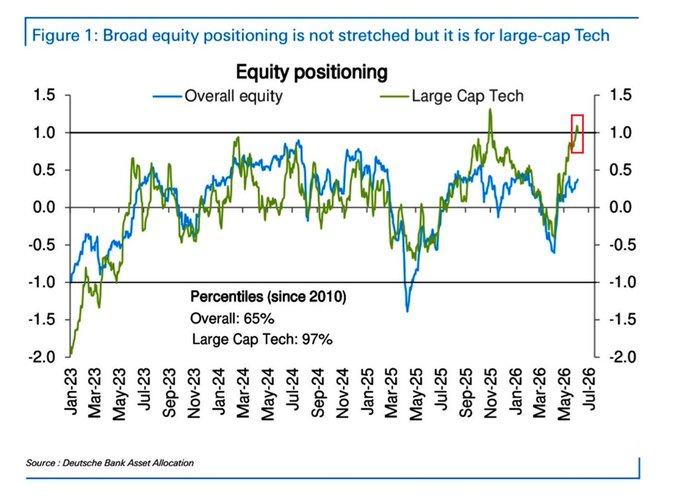
AI Stocks Account for Nearly All of the S&P 500’s Recent Gains image 0 Source:

At that level of concentration, any catalyst that forces selling does not produce an orderly rotation. It produces a liquidation.

The specific trigger analysts are watching:

  • Real yields moving higher would immediately reprice long-duration AI stocks
  • A cost-of-capital shock hits all these names simultaneously, not sequentially
  • Smart money is described as quietly distributing to retail momentum buyers right now
(adsbygoogle = window.adsbygoogle || []).push({});

The dot-com comparison is unavoidable. In 2000, the top 10 stocks represented 27% of the S&P 500. What followed:

  • The S&P 500 fell 50% over the following two years
  • The Dow Jones, with less tech concentration, fell only 37% over the same period

The difference advocates cite is that today’s technology companies generate real revenue, unlike speculative dot-com businesses. The counterargument is that valuations already price in years of future growth. 

Related: How SIREN Went From AI Memecoin to Boom-and-Bust

div#ce-iframe-ads div#frame { margin: auto; text-align: center; }
0
0

Disclaimer: The content of this article solely reflects the author's opinion and does not represent the platform in any capacity. This article is not intended to serve as a reference for making investment decisions.

Understand the market, then trade.
Bitget offers one-stop trading for cryptocurrencies, stocks, and gold.
Trade now!

You may also like

VIPAI Asset Sell-Off and Selective Rotation in Crypto

1. Technology stocks fell sharply as investor interest shifted toward energy and selected defensive assets. From October 10 to 16, the Nasdaq 100 declined 5.49% and the S&P 500 fell 1.95%, while the Dow gained 0.67% and WTI crude rose 10.41%. BTC, ETH, and SOL declined 1.27%, 2.65%, and 4.44%, respectively. This week's technology earnings will be an important test of whether revenue growth, margins, and cash flow can justify current valuations. Better-than-expected results could help stabilize markets in the near term. 2. Crypto continues to see pockets of strong activity, but a broad-based altcoin season has yet to materialize. CoinMarketCap's (CMC) Altcoin Season Index stood at 54 as of the October 18 UTC daily observation, below the altcoin-season threshold of 75, while BTC dominance rose to 60.08%. Our proxy leverage ratio fluctuated between 4.00 and 4.07 during the week, showing no sustained increase and suggesting limited appetite for additional leverage. Meanwhile, as major exchanges expand access to traditional financial assets, the recent sell-off in AI-related equities could attract short-term speculative capital away from crypto. Such capital rotation could make it more difficult for a new altcoin season to take hold. 3. Papertrade's loss-to-mine model has generated significant interest across the crypto community. The protocol combines high-leverage derivatives trading with zero slippage and a mechanism that rewards trading losses with PAPER tokens. Across the eight complete UTC days from October 10 to 17, cumulative reported revenue reached approximately $56.08 million, including $51.90 million distributed to token holders. With growing participation from key opinion leaders (KOLs), Papertrade has reportedly ranked among the top three platforms by profitability in the broader market recently. Assets to watch: BTC, ETH, SOL, ARB, OP, SKHYNIX, SKHY, META, TSLA, LRCX, and SPCX. Key research priorities this week: Cash flow performance in technology earnings; the relative discount and holding costs of the two SK Hynix contracts; and U.S. initial jobless claims and PMI data. Weekly market data cover the period through October 16, while research information was verified through October 18. Observation periods are specified separately for each chart.

Bitget•2026/10/19 06:51
AI Asset Sell-Off and Selective Rotation in Crypto

